
I hear that a lot of people gathered with family for their annual Thanksgiving celebrations last Thursday… almost like a normal year, except the chairs were set a bit further apart.
We were warned. “Don’t get too close.” “Don’t hug.”
My cat Roscoe and I shared a quiet dinner at home, without any guests. Roscoe has no opinion about Thanksgiving, except he does appreciate a plate of perfectly-roasted turkey. Not so fond of the Brussels sprouts, apparently… so I ate his portion.
I didn’t bother making a pumpkin pie, even though I had that big pumpkin left over from Halloween.
Which brings us to the question at hand: “Which Holiday is the Most Frightening?”
I am voting for Halloween.

The jack-o-lanterns are hair-raising enough, and the spiderwebs that appear in the windows and doorways. And then there’s the children dressed up as ghouls and vampires and witches… and unicorns.
But that’s not the scariest part. Especially, not during a pandemic.
Sure, some people would pick Christmas, based on the enormous expense, and the maxed-out credit cards. Also, the mistletoe… and the obligation to drink eggnog.
Other people — especially, people who suffer from Ligyrophobia (fear of loud sounds) — might choose the Fourth of July. Many dogs would also pick that holiday.
But I think this graph, which I found yesterday on the San Juan Basin Public Health website, supports my argument that — at least recently — Halloween is the Most Frightening Holiday.
This Archuleta County graph shows the number of newly confirmed COVID-19 cases each day (the individual vertical lines) plus the one-week trend (the dark purple line).
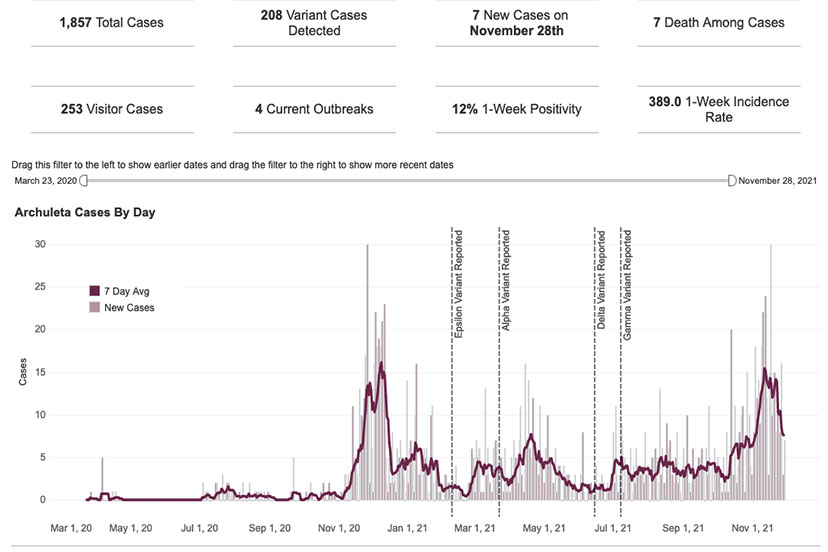
We see an sudden (and frightening) increase in cases in early November 2020… and then a repeat of the very same (and very frightening) increase in early November 2021…
Please note. “Early November.” These increases happened well before Thanksgiving, when we were warned not to gather with our families. (But we did anyway.)
These increases happened right after Halloween.
My theory is not endorsed by Tony Fauci or the CDC, but what I see in this graph is a huge outbreak of COVID infections, just a few days after everyone has been gorging on miniature Snickers bars and Tootsie Rolls.
Yes, I mean “everyone”.
Come on, folks, don’t pretend like you didn’t eat all the leftover candy. (You probably didn’t even wait until Halloween night to start eating the “leftovers”. I sure didn’t. I could never resist a Snickers bar.)
The result? A one-week incidence rate of 398. One of the worst incidence rates in North America.
And speaking of North America…
Here’s another map, from the website Protectivity.com, showing the average sugar consumption per capita in every country of the world.
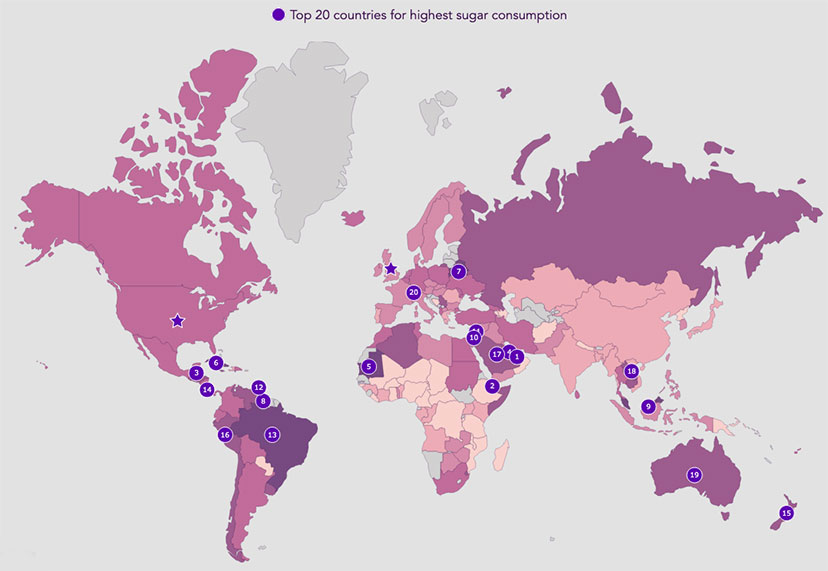
The darker the color, the more sugar people are eating. The U.S. is actually fairly run-of-the-mill, with the average person consuming the equivalent of 8,597 teaspoons of sugar annually.
We’ve all become pretty familiar with world maps lately. (Speaking for myself, after almost two years of COVID news, I can now locate Myanmar and United Arab Emirates.)
I dare you to tell me, this map of sugar consumption doesn’t look identical to all those maps showing global COVID infections.
Trick or treat, folks.
Underrated writer Louis Cannon grew up in the vast American West, although his ex-wife, given the slightest opportunity, will deny that he ever grew up at all. You can read more stories on his Substack account.