
Formally, a projection P is a linear function on a vector space, such that when it is applied to itself you get the same result i.e. P2=P.
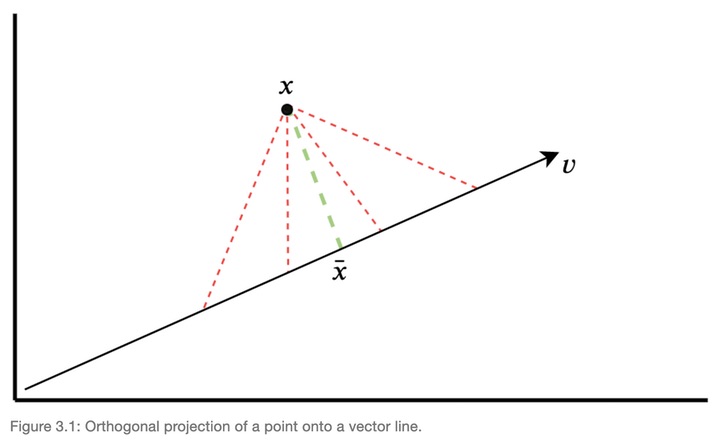
We’re going to be talking, today, about linear projections, and in particular, about ‘water demand’ projections from an engineering firm, Wilson Water Group, which were based on bad data.
As mentioned in Part Five, the San Juan Water Conservancy District (SJWCD) board of directors will hold a public meeting this afternoon, Monday July 25, at 4pm at their office at 46 Eaton Drive, Suite 5.
Here is the Zoom link, for attending online:
https://us02web.zoom.us/j/84727425620?pwd=VmFmRjlHODJ6RnpMbUpYK3BFMmRPUT09
On the agenda is a particular item we might find intriguing, if we have an interest in the water situation in the American Southwest.
7. Consideration of Wilson Water Group Supply and Demand Study
I’ve had a chance to read through the 24-page analysis (which you can download here) and am happy to report that it seems much less inaccurate than the reports written on behalf of SJWCD by water engineer Steven Harris, in 2003 and 2007.
Which is not to say the report from the Wilson Water Group engineers is ‘accurate’.
But it’s ‘less inaccurate’.
The reports from Steven Harris were absolute fairy tales by comparison. The Colorado Supreme Court seems to have agreed with that assessment, because they also rejected Mr. Harris’ data in 2009.
Unfortunately, by the time the Supreme Court tossed out engineer Harris’ fairy tale data, Pagosa Area Water and Sanitation District (PAWSD) and SJWCD, acting jointly, had already purchased the Running Iron Ranch for $10 million, as the location for the proposed “Dry Gulch Reservoir”. The Archuleta County voters (taxpayers) were never allowed to approve the rather sizable debt created.
I will be perfectly frank. Mr. Harris’ ridiculous reports and projections, and the resulting Running Iron Ranch purchase, left this reporter with a bad taste in his mouth for the entire Colorado water industry.
And I have been leery of water engineers’ reports ever since.
Disclosure: I currently serve on the Pagosa Area Water and Sanitation District (PAWSD) board of directors, but this editorial reflects only my own personal opinions, and not necessarily those the PAWSD board as a whole.
Over the past year, the SJWCD board came to the conclusion that the District does not have sufficient and reliable data to justify the Dry Gulch Reservoir, even though SJWCD has been tasked, in a contract with the Colorado Water Conservation Board (CWCB), with moving the Dry Gulch project forward.
Thus, the new analysis from the Wilson Water Group might be viewed, by some, as sought-after ‘reliable data’. As in, a collection of accurate facts that can help us make reasonable decisions.
The analysis begins this way:
Wilson Water Group (WWG) completed an analysis of current and future water supply and demand through 2050 in the Upper San Juan River basin for the San Juan Water Conservancy District (District). The District’s boundary includes both the Town of Pagosa Springs and rural areas of Archuleta County. Like many Colorado Mountain towns, the Town of Pagosa Springs and surrounding areas have seen unprecedented growth. Along with the growth, the San Juan region has been experiencing a ‘millennial drought’.
Here, we have four statements that appear to be facts. Yes, WWG has completed an analysis. Yes, the SJWCD district includes the Town of Pagosa Springs and certain rural areas of Archuleta County. Yes, the community has experienced several years of unusually low precipitation since 2001.
But… have we seen “unprecedented growth” during the “millennial drought”?
“Unprecedented”… as in, “never happened before”?
According to U.S. Census data… not even close to “unprecedented”.
Between 1971 and 1980, Archuleta County experienced an annual growth rate of 3.4 percent.
Between 1981 and 1990, Archuleta County experienced an annual growth rate of 4.6 percent.
Between 1991 and 2000, Archuleta County experienced an annual growth rate of 8.5 percent.
Those were indeed unprecedented, even rather shocking, growth rates… especially between 1991 and 2000.
But all good things must end.
Between 2001 and 2010, Archuleta County experienced an annual growth rate of 2.2 percent.
Between 2011 and 2020, Archuleta County experienced an annual growth rate of 1.1 percent.
During the ‘millennial drought’ our population growth has been the opposite of “unprecedented”.
In real life, growth and change don’t happen in a straight line, nor do they happen in a predictable way. Where societal change and growth are concerned, real life is a roller coaster.
You might even say, real life is a messy juggling act.

But people who are asked to predict the future — including some water engineers — tend to take what happened in the recent past and project the same trends in a straight line, far into the future. These predictions are inherently inaccurate, because life is not a straight line.
The predictions are even less valid if you start with inaccurate data. And if you ignore common sense.
Take, for example, the very first chart that appears in the Wilson Water Group’s analysis.
Roughly 75% of the Archuleta County population gets their treated drinking water from PAWSD, and the 2020 Census estimate for Archuleta County’s population was about 13,366. Multiply 13,366 by 75% and you get about 10,025 PAWSD customers.
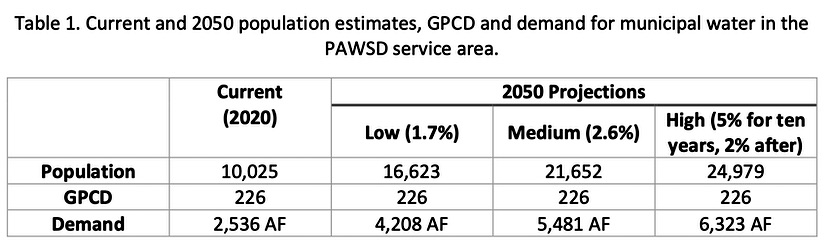
WWG then calculated the “Demand” (PAWSD water demand) for the year 2050, using linear projections for three possible future populations. If the population growth were, say, 1.7% for the next 30 years, you simply multiply “2,536 Acre Feet” (2020) by a compounded rate of “1.7%” and find that PAWSD will have 4,208 Acre Feet of Demand in 2050.
It’s a straight line, from 2,256 AF to 4,208 AF. Or from 2,256 AF to 6,323 AF. Simple.
Archuleta County has never grown in a straight line, as we see in the widely variable growth rates from 1971 through 2020.
But even more importantly, PAWSD water demand has not followed population growth. Not even close.
Even though the chart above was created by engineers, and even though engineers are trained to understand how numbers work… the numbers in the WWG chart above are wrong… rather seriously wrong… and not merely because they are linear projections. They are linear projections based on the wrong numbers.
Below are some real facts in a different chart, which were unfortunately ignored by the Wilson Water Group. I’ve shared this chart before; it was created by mathematician John Ramberg in 2011 when he wrote a report for the PAWSD Board, summarizing the findings of the Water Supply Community Work Group. (You can download that report here.)
These are actual facts because they have already happened, starting in 2001 and ending in 2010, and because they are based on actual measurements.
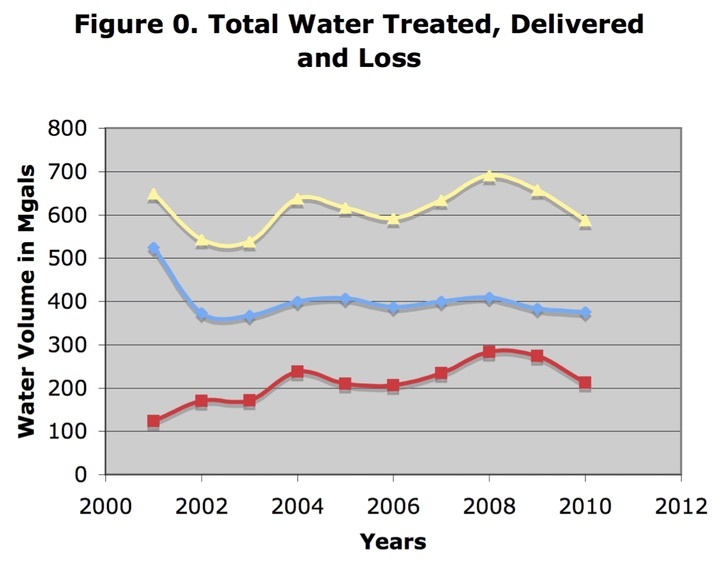
In 2001, PAWSD sold 510 million gallons of treated water to its customers. That’s 1,565 acre feet.
Then the population grew by 22% between 2001 and 2010. At the end of that growth, in 2010, PAWSD sold about 373 million gallons, or about 1,145 acre feet of water.
Then the population grew by another 10%, through 2021. In 2021, PAWSD sold 1,353 acre feet of water. (I got these numbers directly from PAWSD.)
After 20 years and 32% population growth, PAWSD customers in 2021 were using less water than they were using in 2001.
Did the Wilson Water Group include this information in their expensive but inaccurate analysis? Unfortunately not.
Instead, Wilson Water Group combined the PAWSD water sold in 2020 (1,350 AF) with the 300 AF of raw, untreated water used by the Pagosa Springs Golf Club, and also included the 400 AF of treated PAWSD water that leaks out every year through poorly maintained water pipes, plus the 200 AF used to flush the treatment plants… and gave us the 2020 “water demand” as 2,256 AF.
Then, adding together the golf course water, the leaked water, the flushing water, and the water actually sold… WWG multiplied by 1.7%… or 2.6%… or 5%… for 30 years into the future. And called it “Demand”.
Is the Pagosa Springs Golf Course going to grow by 1.7% — or 5% — each year, for 30 years? Probably not. But the Pagosa Springs Golf Course — which uses about 20% of the water supplied by PAWSD — is not mentioned in the WWG analysis.
Will PAWSD water line leaks grow by 1.7% — or 5% — each year, for 30 years? We hope not. But we note that the word “leaks” does not appear anywhere in the WWG report.
Will PAWSD customers, 30 years from now, still be using less water than in 2001? Seems very possible, based on actual data. But WWG, for whatever reason, chose not to look at the actual data.
Starting right on the first page of its 24-page report, the engineers at the Wilson Water Group are giving the San Juan Water Conservancy District inaccurate information.
“But that is not all, said the Cat in the Hat. Oh, no. That is not all…”