
A bewildering amount of data was presented on March 31 during a public Zoom meeting hosted by Mountain Studies Institute and the Upper San Juan Water Enhancement Partnership (WEP), and much of my bewilderment was related to a series of graphs and charts shared by Lotic Hydrological principal Seth Mason, concerning water flows in the San Juan River over the past 30 years, and projections of water flows in the future.
Not so much that the information was difficult to parse (although some of it was)… but more along the lines of, “Well, what does the Pagosa community want to do with this data? And what could the Pagosa community do with this data?”
For example:
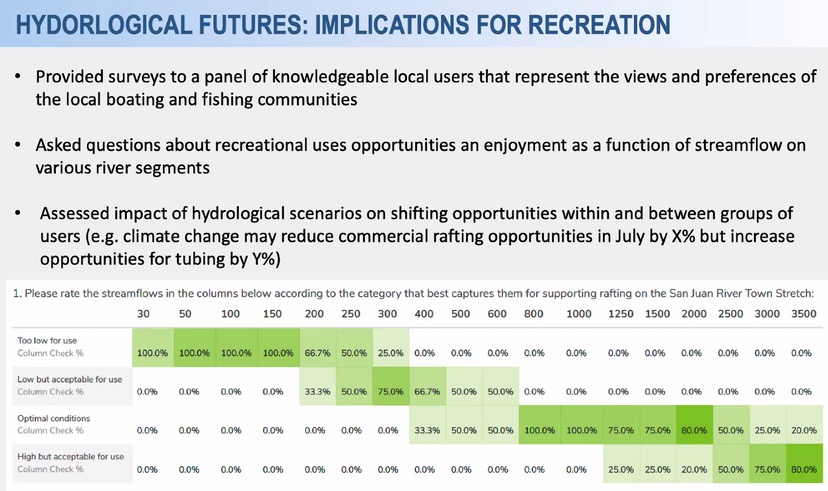
With the intention of better understanding what the hydrological futures might be for the San Juan River, at least in terms of recreational uses, Lotic Hydrological surveyed a panel of “knowledgeable local users” who know something about fishing and rafting in the San Juan. 100% of the expert panel felt that San Juan River flows of 150 cfs (cubic feet per second) or lower did not support rafting activities in the river. At the other end of the spectrum, 100% of those surveyed felt that folks could have an ‘optimal’ rafting experience at around 800-1000 cfs.
When conditions don’t support rafting, of course, they might still support tubing.
Before I get too far in questioning the role of hydrological data like this, I’ll just say that I consider river behavior — like climate behavior — to be an incredibly complex system, and that no one can possibly understand it fully. For one thing, the behavior of our rivers and streams in Colorado is, to some degree, dependent upon political decisions about water rights and public spending, and if you focus only on “scientific data” you will be at a disadvantage, in terms of seeing the full picture.
Meanwhile, scientific data can be useful, when facing political decisions… while understanding that even scientific data can be (and often is) influenced by a political perspective.
Note: I currently serve on the San Juan Water Conservancy District board of directors, but this editorial series reflects only my personal perspectives and opinions, and not necessarily the perspectives or opinions of anyone else on the SJWCD Board.
Daily Post readers who’ve played in the San Juan River — swimming, inner-tubing, rafting, kayaking, fishing — have probably noticed that the flow of the river is higher during spring runoff, and lower the rest of the time. For example, during the past 365 days, the river’s high flows (about 2,000 cfs) occurred around May 1, 2020… and the low flows (around 20 cfs) happened during October. The flows this week have been around 700 cfs. (Data from the US Geological Survey website.)
One of the things I enjoy about Pagosa Springs — and that many other people also enjoy — is the change of seasons. During the winter, we can ski and snowshoe and ride snowmobiles, or just sit home reading a good book by the fireplace. In the spring, we can plant the garden, and maybe take our chances rafting the San Juan during high-water.
These two seasons — winter and spring — are not great times for fishing or inner-tubing or swimming in the San Juan. Different activities require different conditions. And I suspect that is the essential meaning behind the chart, above, developed by Lotic Hydrological. Some conditions are better for rafting than other conditions, according to knowledgeable people. Some conditions are better for swimming. Same with fishing.
But… if we wanted to “Enhance” the natural conditions? Would it be possible to modify the behavior of the San Juan River, artificially, so that a two-month recreational ‘rafting season’ could be extended by a couple more weeks?
I assume this type of question is behind the Lotic Hydrological chart shown above… and was likewise driving a whole series of ‘hydrological data’ charts presented on March 31 during the WEP Zoom meeting.
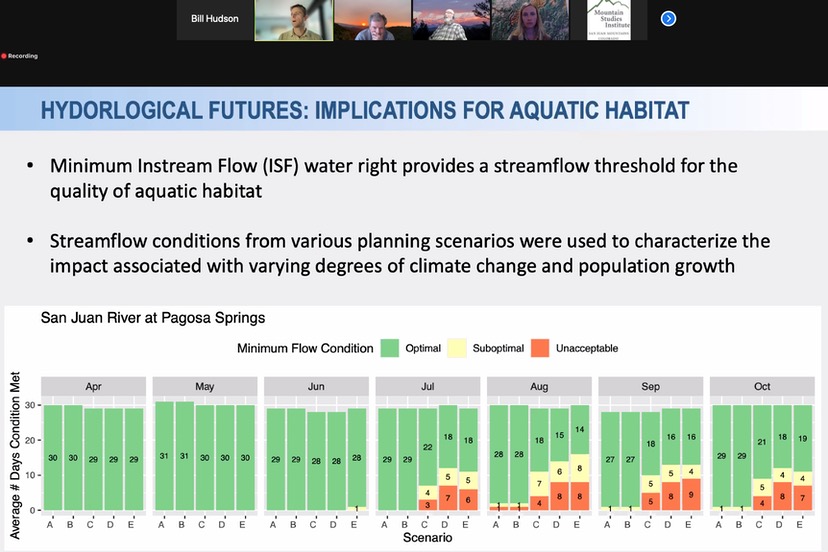
As we see here, Mr. Mason is addressing the “Minimum Instream Flow” conditions of the San Juan River “at Pagosa Springs” — which I interpret to mean, “near the USGS gauge in downtown Pagosa.” The Colorado Water Plan and related research projects have determined that the amount of water in our rivers and streams is dependent upon two essential quantities: the amount of precipitation provided by Mother Nature, and the amount of water diverted out of the rivers and streams for various human activities. Mr. Mason, in the chart above, seems to be suggesting that “aquatic life” (fish, insects, plants, etc) might be stressed and perhaps endangered in the future — as shown by the yellow and orange colored bars — if Mother Nature and human activities take certain directions in the future. Scenarios which imply “less water in our rivers” are labeled “C”, “D” and “E”.
Should we embrace scenarios “A” and “B” — which assume minimal change in future river conditions — as most likely, and not worry too much about the future?
Should we assume that “aquatic life” is not stupid, and will find survivable locations in our rivers and streams, even if scenarios “C”, “D” and “E” were to happen?
Lotic Hydrological also graphed out future scenarios for ‘boating’ and ‘wade fishing’ based upon the suggestions made by their expert panel, and found that future river conditions might effect the success of certain recreational pastimes at certain times of the year.
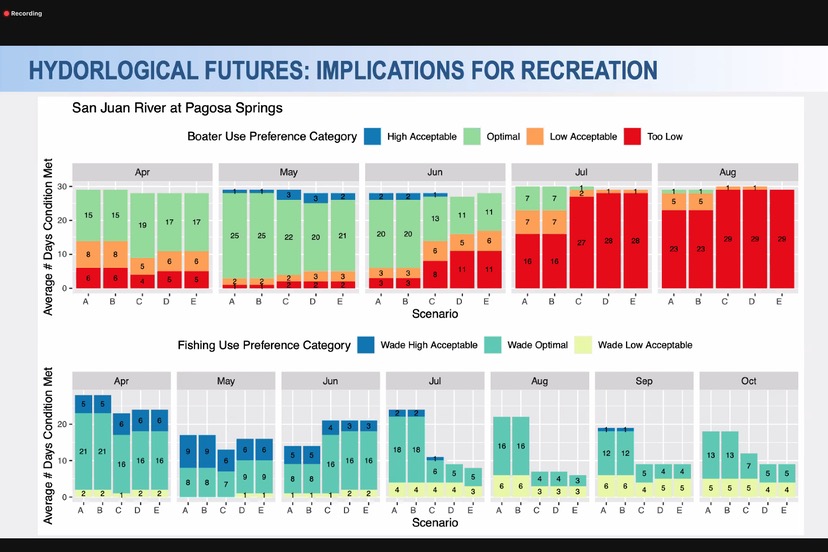
Again, my main question would be, “What does the Pagosa community want to do with this information?”
I want to express my appreciation to Seth Mason, who took time out of his busy schedule to respond to some of my questions about his data presentation. In particular, I had questions about some data showing an historical decline in San Juan River flows during our peak tourist months — July, August, September — when comparing the 1990s to the 2010s. Mr. Mason noted that the declining flows during those three summer months, might be due to “earlier peak flows”. I’ve come across numerous media reports in recent years suggesting that we’re seeing warmer spring weather in the American Southwest… which would naturally result in earlier melting of our winter snowpack, and less water in rivers during the latter part of the summer.
Which again highlights the complexity of measuring environmental and recreational river conditions, even when we have access to historical data.
The complexity of predicting the future is much more challenging. Believe me, I’ve tried, and it doesn’t always work out well.