
This story by Sarah Melotte appeared on The Daily Yonder on January 21, 2026.
This post is from the data newsletter, the Rural Index, headed by Sarah Melotte, the Daily Yonder’s data reporter. Subscribe to get a weekly map or graph straight to your inbox.
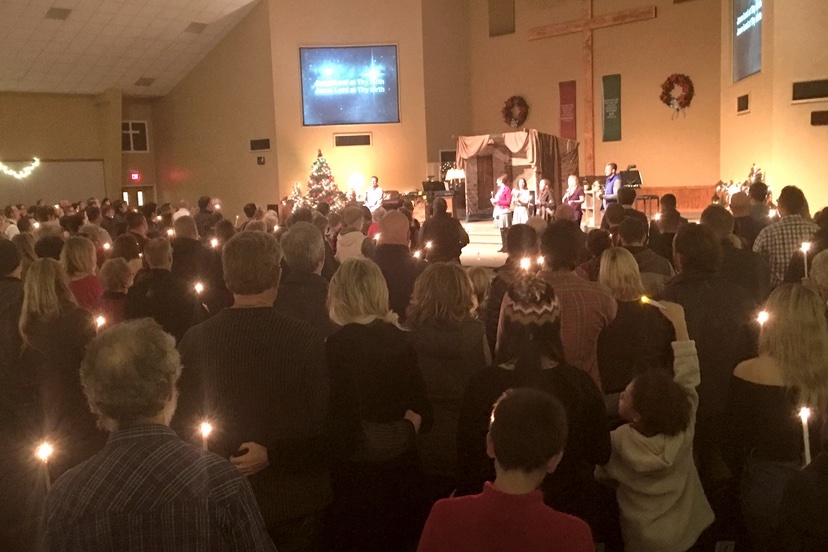
Non-denominational Christianity is growing nationwide, but rural areas still have lower rates compared to their urban and suburban counterparts. In this edition of the Rural Index, I’m exploring the spatiality of non-denominational Christians using data from the 2020 US Religion Census.
Amid an overall decline in religious affiliation nationwide, the share of Americans who identify as non-denominational Christians is actually on the rise. In 1972, only about 3% of Americans identified as non-denominational Christians, according to the General Social Survey. In 2024, the latest year of available data, that number rose to 14% of Americans, representing about 40 million people.
In an interview with CBS News, social scientist and data expert Ryan Burge said it’s possible that non-denominational Christians could soon outgrow Roman Catholics, becoming “the largest religious tradition in America.” In a 2023 post, Burge wrote that the rise of non-denominational Christians is the second biggest story in American religious trends right now. (The first biggest story is what Burge calls the rise of the nones, or the religiously unaffiliated.)
According to Burge, the common refrain about non-denominational churches is that they are essentially Southern Baptists without the associated institutional baggage. In fact, this is exactly how I’ve described the non-denominational congregation I grew up in. But Burge’s analysis of data from the General Social Survey suggests that the two groups hold different views about the interpretation of the Bible.
“It’s pretty apparent to me that Southern Baptists are more likely to take a literal view of the Bible than non-denominationals,” Burge wrote. “Based on the General Social Survey, nearly two-thirds of Southern Baptists can be categorized as biblical literalists, while this view is held by just 44% of non-denominationals.”
Non-denominationals and Southern Baptists are seemingly politically aligned, however. According to Burge’s analysis, Trump won 76% of the non-denominational vote and 72% of the Southern Baptist vote in 2020.
These trends are obviously more complex on the ground. And theological beliefs vary from church to church. But I hope these figures help you get a generalized view of non-denominational Christianity.
According to the 2020 US Religion Census, non-denominational churches make up more than 44,000 congregations ranging from small house churches to megachurches and networks of independent churches. The US Religion Census is a county-level, once-per-decade dataset that reports the number of congregations and adherents in American faith groups.
The following map shows the county-level adherence rate, measured by the number of non-denominational adherents divided by the 2020 population. In the census, the term ‘adherents’ refers to individuals who regularly attend a specific congregation.
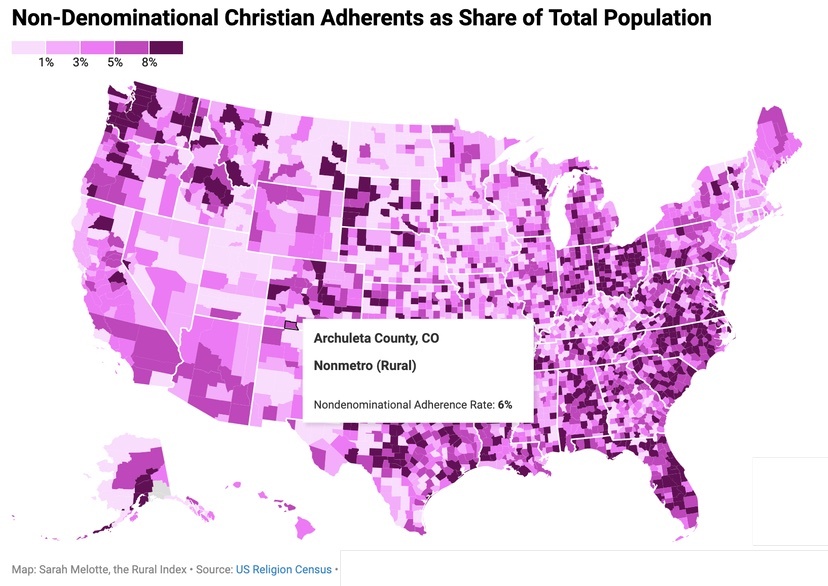
In 2020, the nationwide non-denomination rate was just over 6%. In rural counties, that number was about 5%. (Please note that you should not directly compare these figures to the survey data cited above. While the US Religion Census measures organizational affiliation, survey data measures personal belief.)
The county categories in the following graph are based on the Daily Yonder’s usual binary system of metropolitan and nonmetropolitan, or rural, counties. But instead of sticking with one category for metros, I broke them up into different sized cities and their surrounding suburbs. Major metro core areas are cities in counties that have more than one million residents. Medium-sized cities are in counties that have populations between 250,000 and one million residents. And small metros have populations fewer than 250,000 residents.
At about 8% of the population, medium-sized cities had the highest non-denominational adherence rate, while all the other geographies were slightly lower.
The variation between different sized counties isn’t huge, and some of it falls well within the margin of error. I was curious what the data might look like if I zoomed in on rural counties. Are there any spatial characteristics associated with non-denomination rates?
The following map shows the rural non-denomination rate by state. States like New Jersey, Rhode Island, and Delaware are hidden from this analysis because they don’t have any nonmetropolitan counties. (Connecticut is excluded from this analysis because of their recent shift towards Planning Regions instead of counties.)
I found a concentration of high non-denomination rates where you might typically expect them – in the Bible belt of Appalachia and the American South. If the refrain is true, that non-denominational churches are just Southern Baptist without the baggage, then this makes sense. In rural West Virginia, the non-denomination rate was approximately 10%. In rural Florida, it was 9%.
But I was surprised to find that Washington state rivaled the Bible belt in non-denomination rates. In rural Washington, the non-denomination rate was 10%. This is especially surprising to me since the surrounding states had significantly lower rates. In Oregon and Idaho, the rural non-denomination rates were 5% and 3%, respectively.
When I picture non-denominational congregations, I imagine mega churches in massive suburbs with acres and acres of parking lots. Although this wasn’t true of the church I grew up in, I still tend to associate non-denominational Christianity with stadium-like sanctuaries in major metros. It seemed to me that non-denominational churches gained popularity concomitant with the rise of network churches like Elevation Church, a megachurch based in Charlotte, North Carolina, with 40 satellite locations mostly concentrated in the American South.
With this in mind, I was curious if the size of the nearest metro area influenced non-denomination rates in rural counties. I thought I would find that rural counties closer to the nation’s largest cities would have higher rates than other geographies, but what I actually found was more complicated than that.
In rural counties where the nearest metro county was small (less than 100,000 residents), the median non-denomination rate was the lowest compared to other geographies – about 7%. This did not surprise me. What did surprise me, however, was that in rural counties where the nearest metro was between 100,000 and 399,000 residents, the median non-denomination rate was 14%. That’s quite high.
In rural counties where the nearest metropolitan county had more than one million residents, the median non-denomination rate was only 11%. I expected this county type to have the highest rate.
I don’t know what’s driving the spatial distribution of non-denomination rates, but I suspect it has to do with something other than rurality itself.
This article first appeared on The Daily Yonder and is republished here under a Creative Commons Attribution-NoDerivatives 4.0 International License.