
He also said to the crowds, “When you see a cloud rising in the west, you say at once, ‘A shower is coming.’ And so it happens. And when you see the south wind blowing, you say, ‘There will be scorching heat,’ and it happens. You hypocrites! You know how to interpret the appearance of earth and sky, but why do you not know how to interpret the present time?
— The Book of Luke, 12:54-56
It’s been especially windy in Pagosa Springs these past few weeks, seems like. But I can’t say for sure. It’s also seemed pretty warm and dry, so far, this year.
I wouldn’t presume to guess why some days are more windy than others, or why some years are drier than others. Weather and climate are far too complicated, for this news editor.
I don’t understand societal violence, either, and I can’t pretend to say I do. I wonder how many people think they understand violence?
A few years ago, investigative journalist Kevin Drum took a stab at explaining violence in America — in particular, the dramatic and seemingly inexplicable increase in violent crimes between 1960 and 1990, and the equally dramatic and surprising drop in the crime rate between 1990 and 2019. His research appeared in a 2018 article in Mother Jones magazine.
We looked at some related statistics back in Part One, in a graph included in a 2014 analysis by James Alan Fox, Michael Rocque and Chad Posick, conducted by Northeastern University School of Criminal Justice. You can download the report here.
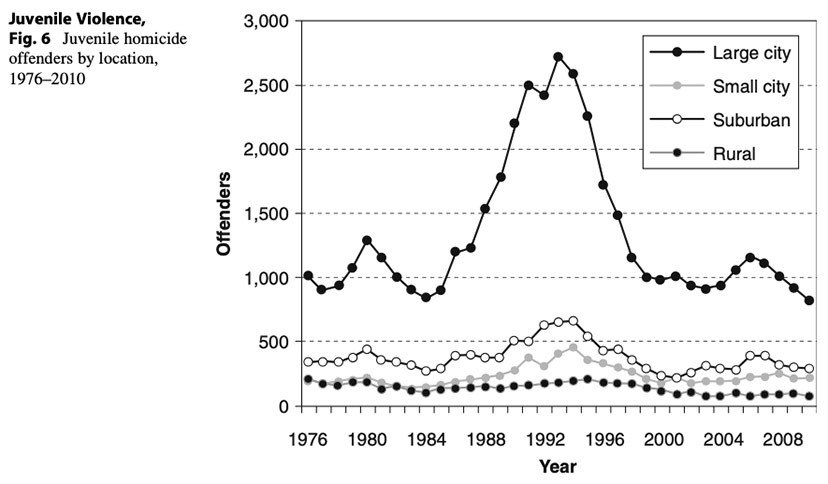
We note the remarkable difference between the juvenile crime rate in big cities, compared with most anywhere else.
In his 2018 Mother Jones article, journalist Kevin Drum included a similar graph, with some additional information. Mr. Drum had spent several years looking at the correlation between the epidemic of lead poisoning in American children — especially, children living in big cities plagued by automobile-generated pollution — and the rise and subsequent decline in the rates of violent crimes, before and after the EPA outlawed lead-based gasoline. From the article:
Brain studies. Neurologists have performed MRI scans of adults who were exposed to lead as children. They’ve found that because lead is chemically similar to calcium, it displaces the calcium needed for normal brain development.
Prospective studies. These are studies that begin in childhood and follow a group of children through adulthood. The children are measured along the way and their adult outcomes are catalogued. Several prospective studies have shown that children who are exposed to high levels of lead are more likely to be arrested and incarcerated for violent crimes later in life.
Population studies. These are studies that depend on statistical analysis of groups, rather than individuals. Dozens of population studies have found strong correlations between the exposure of a group to lead and the level of violent crime committed by the group later in life. These groups can be neighborhoods, cities, states, or countries.
From Wikipedia:
Individuals exposed to lead at young ages are more vulnerable to learning disabilities, decreased I.Q., attention deficit hyperactivity disorder, and problems with impulse control, all of which may be negatively impacting decision making and leading to the commission of more crimes as these children reach adulthood, especially violent crimes…
For the U.S., the correlation between lead and crime looks like this, according to Mr. Drum:

This graph is a bit tricky to read correctly. The green line — showing the average amount of lead found in a typical preschool child’s blood — relates to the years also shown in green, at the bottom of the graph, ashowing blood-lead levels increasing from about 5 μg/dL in 1937 to about 23 μg/dL in 1970. Following the EPA-mandated phaseout of lead-based gasoline and bans on lead paint, the average child blood-lead levels fell to about 3 μg/dL in 1989.
The CDC’s current approach to lead poisoning: “CDC recommends children with a blood lead level at or above the blood lead reference value of 3.5 μg/dL be referred for follow-up.”
Because lead slowly accumulates in the body over time, especially in a person’s brain, the effects of excess lead in the bloodstream may not be noticed or felt until the child is a young adult. The blue line in Mr. Drum’s graph show the still-unexplained increase in the violent crime rate between 1960 and 1990, using the blue years at the bottom of the graph — 23 years later than the blood-lead levels shown by the green line. The decrease in crimes after 1990 can be correlated to the decrease in lead exposure, 23 years later.
As mentioned in Part Three, people working in education and in health care reported increased threats of violence during the (ongoing) COVID crisis. Various reports suggest that crime, in general, decreased during the crisis in most communities — including a decline in the number of robberies and rapes — but certain types of crimes reportedly increased since COVID arrived in the winter of 2020, including homicide rates. In some cities, the murder rate increased by as much as 40% between 2019 and 2022. The homicide rate increases were reportedly greatest in Black and Native American communities.
America’s suicide rate dropped by 3% during 2020, compared to 2019, but the rate of suicides increased slightly among teens and young adults.
These numbers have no clear explanations.
The increased incidence of gun violence in our schools — increasing from about 331 events in the decade between 2002 and 2011, to about 849 in the decade from 2012 and 2021 — likewise has no obvious explanation.
We are unable to account an increase of about 260% in the number of school gun incidents, when comparing the two decades.
During that same two decade period — that is, between 2002 and 2021 — American gun owners added roughly 1 million guns per year to their arsenals, amounting to a total increase in the number of privately-owned guns of about 5% during that decade.
A 5% increase in unregulated gun ownership seems, to me, an unlikely reason for a 260% increase in school shootings. or for a 40% increase in homicides during the COVID crisis.
Meanwhile, it would appear that we no longer have to worry about lead-based gasoline poisoning our children.
Is something else poisoning our children?