
We’ve been discussing a public meeting hosted by the Archuleta School District and held at the Pagosa Springs High School Auditorium on April 10, following a couple of reported threats of gun violence at district schools. The panel doing the presentation included members of the ASD School Board, the District Superintendent, the principals at the District’s three schools, the Archuleta County Sheriff and Undersheriff, and Pagosa Springs Police Chief and Assistant Chief.
As mentioned before, the event was a chance for the District to explain — and apologize for — its handling of recent threatening remarks related to ASD schools. The District also wanted to give parents and the public to ask questions and air complaints… which several of the attendees were willing to do, as summarized in Part Three.
The audience turn-out was modest… about 50 people. This could possibly indicate that parents are not especially concerned about threats in the schools. It might also indicate that parents are terribly busy and not able to attend a panel discussion on the topic of gun violence prevention. Or it might indicate that people didn’t hear about the event.
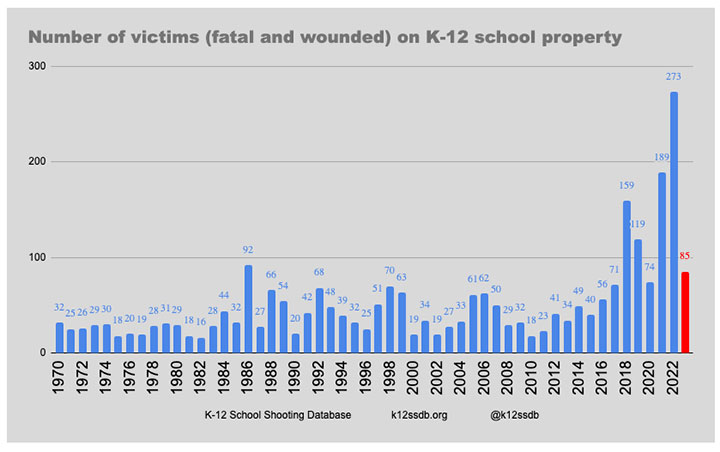
In Part One, I shared the following chart Violence Project’s “K-12 School Shooting Database” maintained by researcher David Riedman. It shows dramatic spikes in gun-related injuries and deaths on school property, in 2018 and 2019, and in 2021 and 2022.
2023 appears headed for another spike.
I admit to wondering, over the past few days, if I want my grandchildren to continue attending public school.
This is only a small part of the whole story, however… if we’re talking about how dangerous America is, for young people.
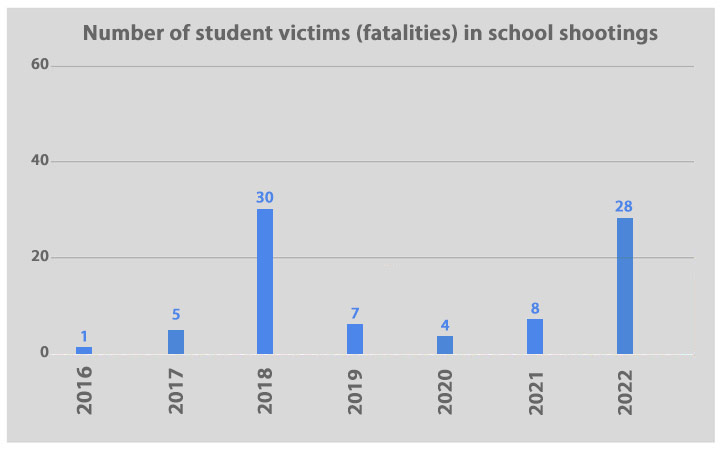
For example, if we are talking statistics, below is a chart similar to the “K-12 School Shooting Database”, but showing only the student fatalities — not the injuries — due to school shootings between 2016 and 2022. This graph (created by the Daily Post) addresses high school age or below — not college or adults — and also does not include suicides or a shooter who was killed. (Note that the vertical axis goes up to “60” rather than “300” as on the “K-12 School Shooting Database” graph above.)
I thought we ought to have a clearer picture of “student” fatalities, since we’re talking about “school safety” in Pagosa Springs.
I left some space between the columns, because I want to compare school shooting deaths with some other fatality numbers.
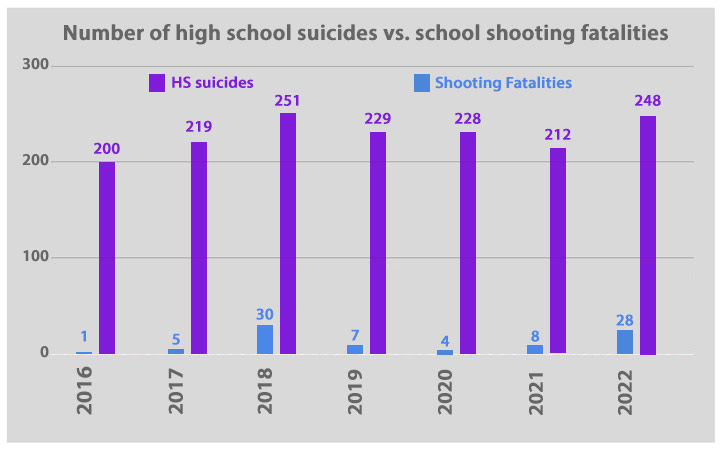
Below is a related graph, also made by the Daily Post, that includes the number of the young people who have committed suicide, from 2016 through 2022, compared to the number killed in school shootings. The numbers are calculated (by the Daily Post) based on reported suicide rates and reported high school enrollments in the U.S…. so the numbers are admittedly approximate.
As you will notice, the vertical axis has been revised to reflect larger numbers. 0-300.
We can ask ourselves: What problem is most serious, among school-age children?
Oddly enough, although “school shootings” data is fairly easy to find online, stats clearly showing the number of teen suicides in the U.S. over the past seven years has proved pretty much impossible to locate. But according to the numbers I am able to calculate, the number of high school students who are committing suicide each year is from 10-to-50 times the number of students — including all ages — killed by gun violence in schools.
Our community has spent millions of dollars in tax revenue and grant funding, to make our student “safer”, by remodeling our buildings to make entry more difficult and inconvenient, running stressful ‘shooter drills’, and paying for “school resource officers”.
But all this money has apparently gone into preventing one of the least serious “causes of death” among students.
What’s worse than school shootings, besides teen suicide?
Below is another similar graph, also made by the Daily Post, that compares the number of the high school students who have been killed by drug overdoses between 2016 and 2022, compared with the number of high school age suicides and the number of students killed in school shootings.
As you will notice, the vertical axis has again been revised to allow for larger numbers. 0-1200.
And once again, I was not able to easily find this data; the only numbers I could definitely verify were for 2020 and 2021. The numbers for 2016 through 2019 are estimates based on calculated data; the estimate for 2022 is just a guess based on a trend.
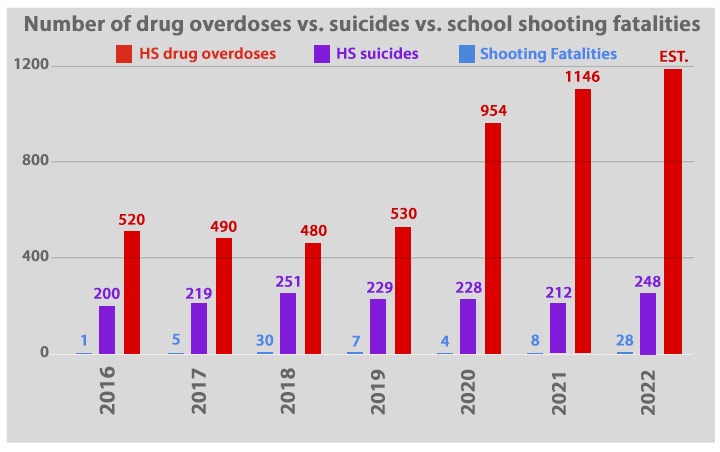
It appears that the number of high school student who die each year from drug overdoses has been twice to six times the number killed by suicide. And up to 100 times the number killed by gun violence in schools.
As these charts clearly indicate, the worst killer among us — among our youth — is not a crazy murderer with an AR-15.
And I didn’t even bother to show the worst killer:
Traffic.
In 2020, about 3,500 children and teens died in roadway accidents. In 2021, the number increased to about 3,680.
In 2021, for example, the number of kids killed by, or in, cars and trucks was about 460 times the number killed in school shootings. In 2020, traffic mistakes killed 875 times as many kids as school shootings.
But, on any given school day, the parking lot at Pagosa Springs High School is packed with cars and trucks, mostly driven by teens. We think nothing of it. It’s a convenience. A deadly convenience.
Do we really want our kids to be safe?
Or do we just want to pretend like we want our kids to be safe?