
In his real estate column yesterday, here in the Daily Post, realtor Lee Riley mentioned the proposed ‘Pagosa Views’ development, and the mixed reaction that the proposal has been receiving.
He wrote:
With this possible new development on the horizon, the debate continues: growth or no growth? The majority of the buyers I deal with want to be the last one in and shut the door behind them.
We will be considering the idea of “growth” in this editorial series. Turns out, it’s a complicated idea.
Unfortunately, defining the debate as “growth or no growth” — as many are prone to do — creates a false dichotomy. Almost everyone is opposed to certain types of ‘growth’. And almost everyone is in favor of other types of ‘growth’.
More about that false dichotomy in a moment.
The Planning Commission for the Town of Pagosa Springs will be considering a fairly significant housing project this evening, Tuesday, August 9, at their 5:30pm meeting in Town Hall.
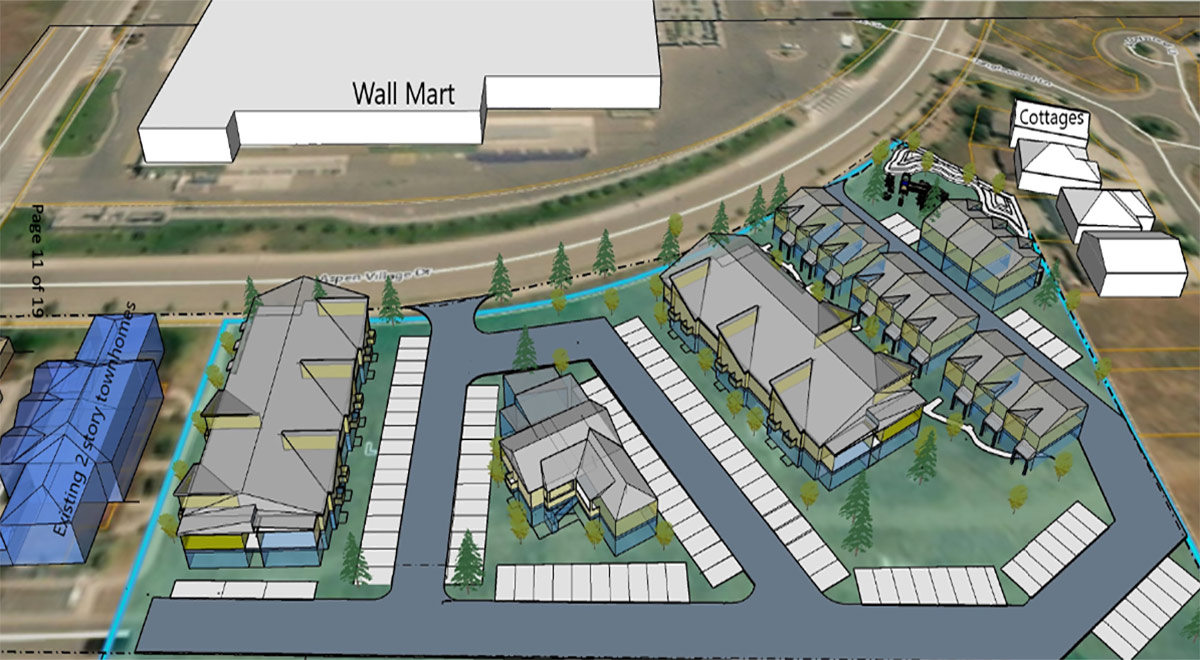
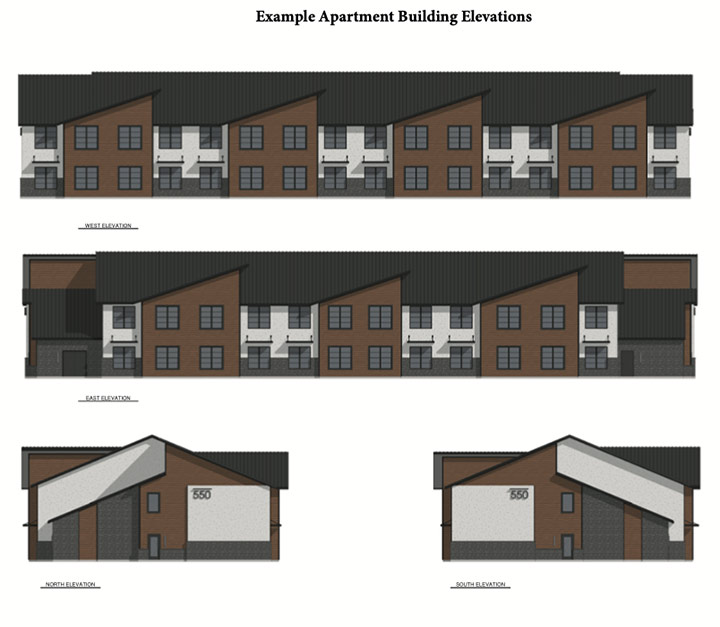
The proposed project is a joint effort by Texas-based housing developer Servitas, and the Town government itself, currently purchasing a 3.5-acre parcel in Aspen Village across the street from Walmart. The 19-page agenda packet includes preliminary sketches of a new 70-unit neighborhood — a mix of two-story apartment buildings, two-story townhomes, a central neighborhood “clubhouse”, and a small public park.
And 108 parking spaces.
In other words, the Planning Commission members will be passing judgement on a “sketch plan” brought forward by the same government that appointed them to their seats. We might see that as a bit awkward, or as extraordinarily efficient.
You can download the 6-page narrative here. The full meeting packet with all the color drawings is available on the Town website, here.
Back in 2006, the Aspen Village subdivision was conceived as a “live/work/play” neighborhood, with bike paths and walking trails and a mix of commercial and residential development. 16 years later, the “commercial” side of development has been somewhat more successful than the “residential” side. The Aspen Village neighborhood now sports the largest retail store in Archuleta County — the 93,000-square-foot Walmart store — plus an auto parts store, a couple of real estate offices, a hair salon, a restaurant, a ski rental shop, a tire store… the typical mix of Pagosa-type businesses. The neighborhood also includes the Pagosa Peak Open School, the only district-authorized public charter school in the county.
Residential homes? Not so many.
The Planning Commission packet includes a couple of other maps, showing the original Enclave neighborhood layout as it was originally conceived… shortly after the creation of the ‘Aspen Village’ subdivision back in 2006. (Not to be confused with the ‘Aspen Springs’ subdivision, which is a totally different animal.)
Here’s an older map that I’ve colorized. The purple indicates the existing ‘Enclave’ condominiums, and the yellow shows the originally-planned expansion of the ‘Enclave’ concept… which was essentially killed off by the Great Recession.
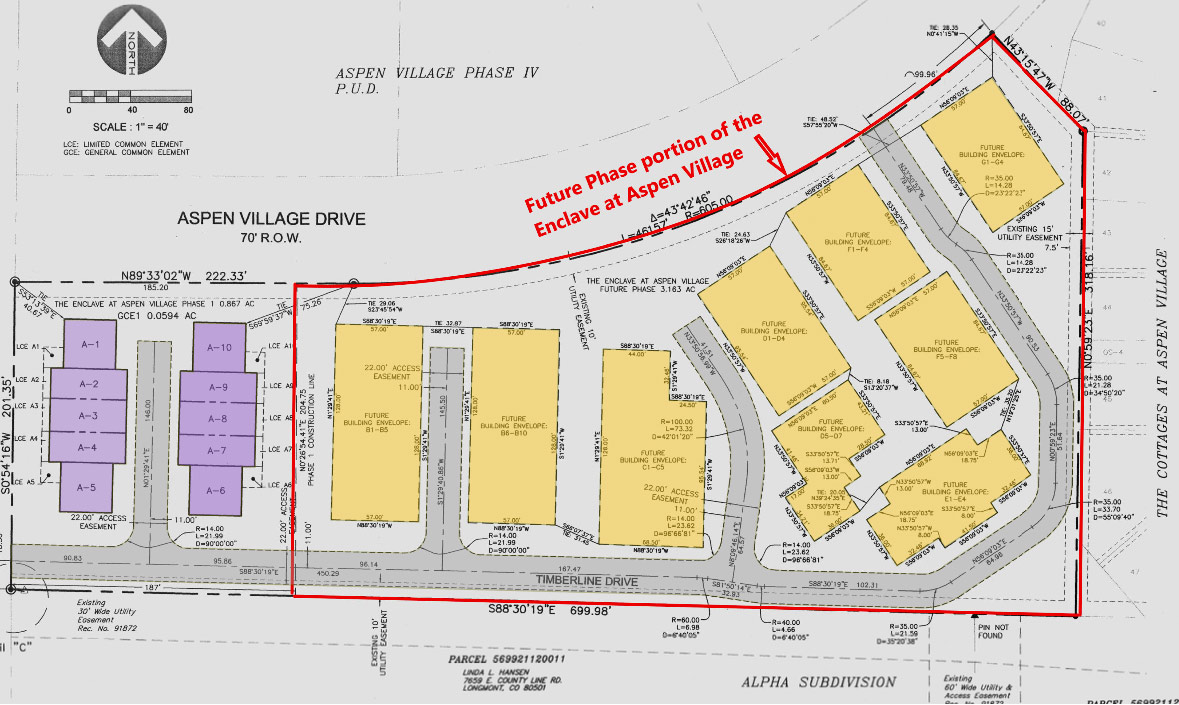
The Walmart was later built just north of this planned neighborhood. Right across the street, in fact.
One thing we might notice about this original layout: a lack of ‘traffic circulation’. During the second half of the 20th century, people assumed that suburban dead-end streets and cul-de-sacs were the best way to preserve residential privacy. But we’ve done such a good job of preserving privacy that the very idea of ‘community’ has become a ghost of its original self. Casual activities and gatherings on the public sidewalk — once an intrinsic (and pleasurable) part of American life — have faded into history.
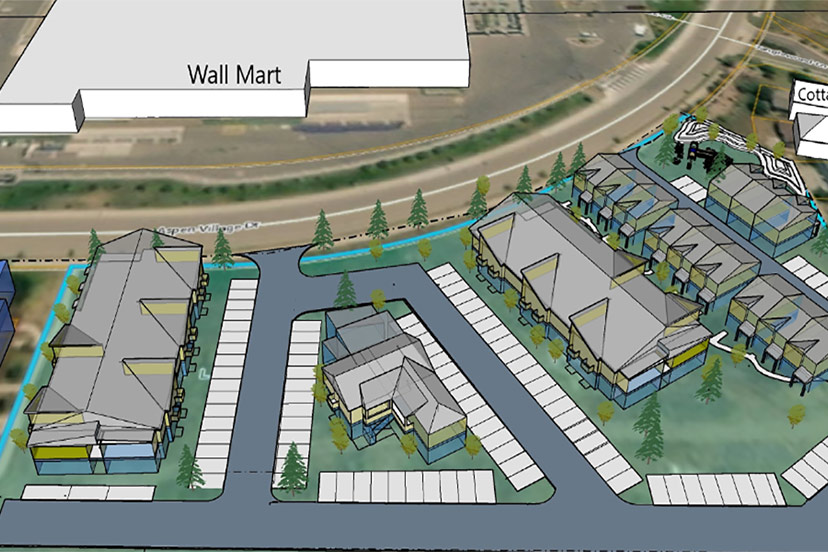
Here’s another map from the packet, showing the original ‘Enclave’ layout (in yellow) overlaid on the new proposed Servitas design.
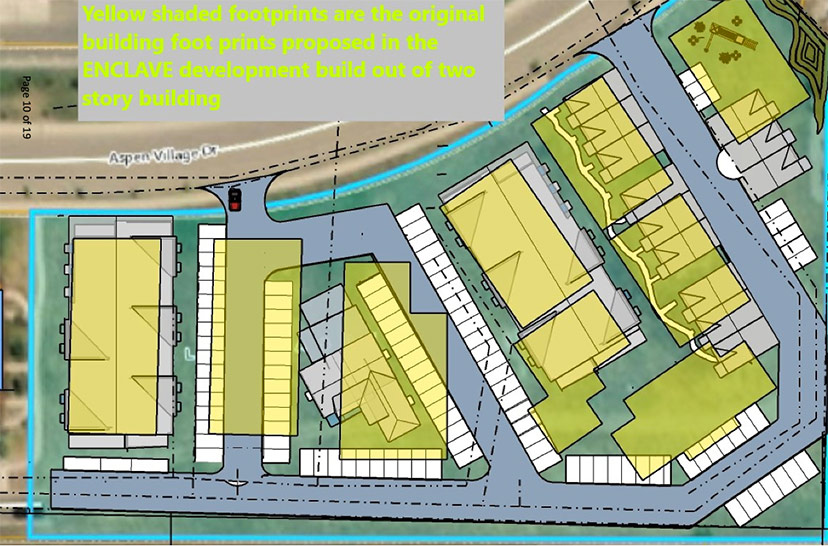
Sixteen years later, it appears that the neighborhood will look something like the original plan. But not entirely the same.
Here’s the new design, without the overlay.
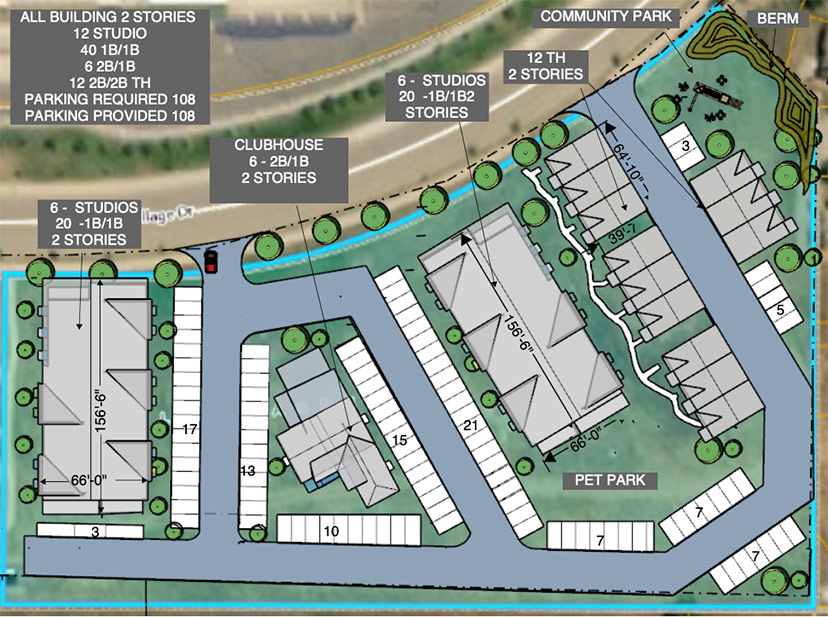
As we might notice in the new design, the improved traffic circulation pattern suggests that people might actually walk over to their neighbor’s house and borrow a cup of sugar. They might walk over to the ‘clubhouse’ for a game of bridge… or some other kind of neighborhood gathering…
We might also notice something else: that the accommodations for automobiles — the paved streets and parking spaces — take up more square footage than the building footprints.
Which leads us to our discussion about ‘growth’. As I said, it’s complicated. And it’s often presented as a false dichotomy. “Growth vs. no growth”.
The scientists who study growth — biological growth, societal growth, technological growth, etc. — have historically defined three basic patterns.
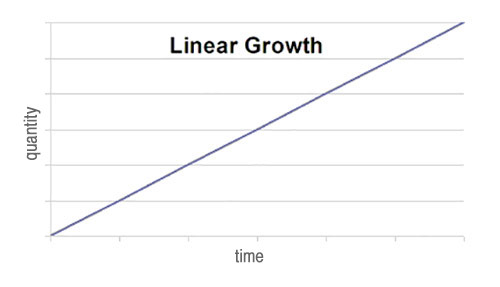
Linear growth.
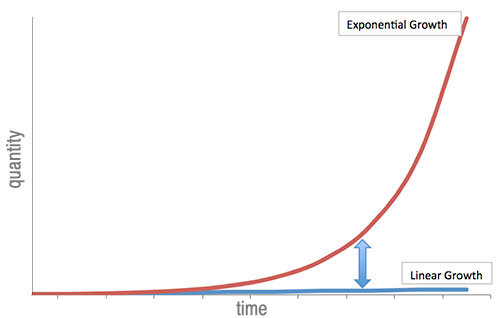
Exponential growth.
Logistic growth.
These are imaginary patterns invented by scientists, mathematicians and statisticians. Reality is much more complex, but I suspect ‘logistic growth’ comes closest to reality, in most cases.
Growth is conceived as the combination of two factors: some type of quantity, increasing over some period of time. When represented in a graph, the horizontal axis typically represents the passing of time, and the vertical axis the changing quantity. Below is a graph showing a ‘linear growth’ pattern. The quantity grows at the same rate with each passing hour, or day, or year, or millennium. This type of growth rarely occurs in nature. But it makes for a nice, clean graph.
‘Exponential growth’ usually involves some type of ‘feedback loop’, where each additional quantity causes the growth rate to increase.
It also makes for an interesting graph.
The kind of graph that people often share, when they want us to be worried, or excited.
When we wanted to get closer to reality, the typical pattern for ‘growth’ is not linear or exponential, but ‘logistic’.
Prior to, say, 1422, typical human existence pretty much followed a flat line, except for the occasional war or natural disaster. Life went along, from generation to generation, without much change. Very few things exhibited “growth”, except for life forms. Flowers, trees, sheep, children. These things grew. (Maybe the king’s treasury grew, as well?)
If a hypothetical statistician were to plot the idea of “growth” in the year 1422, for example, they would probably use a ‘logistic’ graph that somewhat resembled a natural process, like the growth of a child, or maybe a lamb, or an apple tree…
Starts out slowly… then grows more quickly… and finally slows down as reaches its mature size…
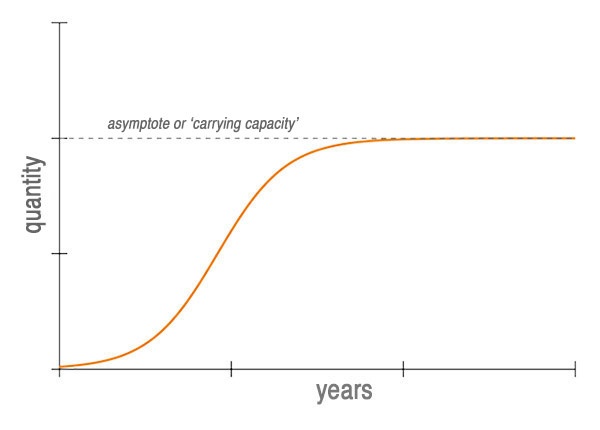
When modern statisticians construct these types of ‘logistic growth’ curves, they refer to the dotted line at the top — where the growth reaches a plateau — as the ‘asymptote’, or as ‘the carrying capacity’.
But none of these graphs — as useful as they might be — represent reality, for two basic reasons. For one thing, reality is messy.
And for another thing, any ‘growth’ graph uses an particular (and sometimes arbitrary) span of time… often chosen to promote this or that agenda.
Below, for example, is a growth chart showing the number of new COVID cases in Israel during the first month of the crisis. During the first two weeks of the outbreak, it seemed like new cases were going to grow in an ‘exponential’ fashion — as predicted by the red curve. But the predictions didn’t pan out. What really happened was a lot messier, as shown by the black line…
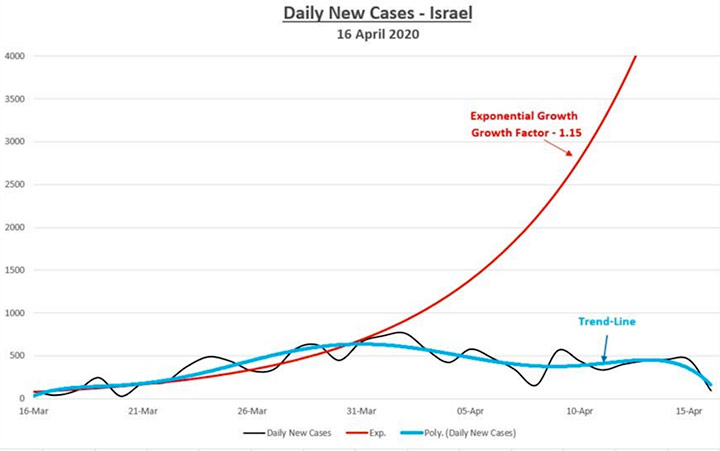
More like a roller coaster than a linear or exponential or logistic curve.
When we’re talking about ‘growth vs. no growth’ in a small mountain town like Pagosa Springs, the reality gets even messier.