
I received a thoughtful email yesterday from one of our Daily Post readers, wondering where this ‘Money, Water, and Fear for the Future’ editorial series is headed.
Was I questioning the very idea of climate change? Was I denigrating journalists and their occasional hyperbole… as a means to discredit the work of authentic scientists?
I will confess that I don’t always know where my editorial series is headed, when I write Part One. Or, more accurately, I always don’t know where the series is headed. I simply start researching and writing, and I’m usually somewhat surprised at where we all end up.
For example, I didn’t know, until yesterday, that an organization called ‘CO2Levels.org’ had created some interactive graphs illustrating the changes in theoretical CO2 levels over the past 800,000 years — a particular period of Earth’s history when the atmospheric CO2 averaged about 250 PPM (parts per million), but fluctuated wildly, dropping as low as 175 PPM in 660,000 BC and rising as high as 300 PPM around 330,000 BC. The highest level on the graph was, of course, 2020, at about 410 PPM.
Below is a slightly shorter version of the timeline: from about 500,000 BC to the present date. Very few of the fluctuations shown can be ascribed to gasoline automobiles, although most scientists would credit the current levels to human causes such as methane, burning fossil fuels, destruction of forests, loss of soil, asphalt paving, and other activities of modern civilization.
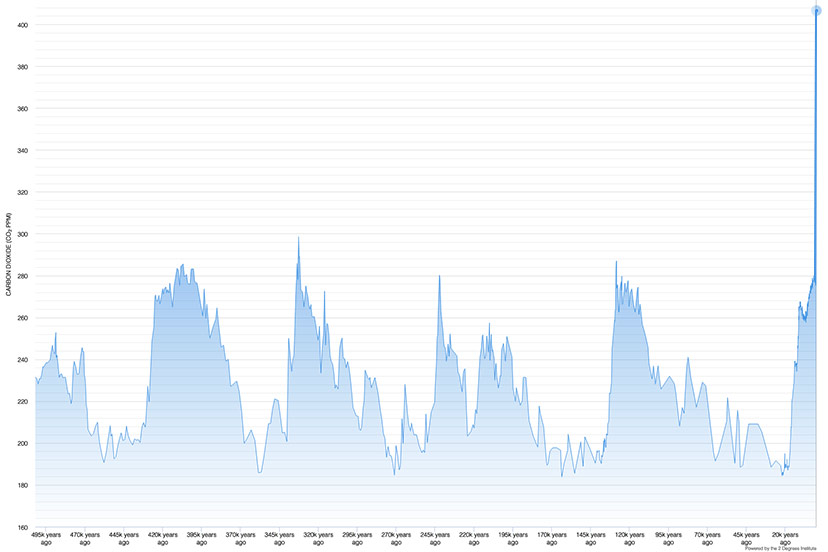
These types of graphs are constructed from data generated by computer models. No one actually knows — or can ever know — if the data is accurate, except during perhaps the past 100 years. The graphs are based, not upon ‘facts’ per se, but upon various climate theories.
You can find other graphs that go back further than 800,000 years, and that suggest much higher levels of CO2 at other periods of Earth’s history — much higher even than in 2022. Those graphs are also built upon theories.
The folks at CO2Levels.org included an option to overlay global temperature anomalies for the same period of time. Here, again, is the graph from 500,000 BC to today, with temperature trends shown in gray. (0º appears to be based upon the average global temperature between 1950-1980):

The global temperature in 2022 is assumed to be about 1º higher than it was, on average, during the mid-20th century.
As we can see, the rise and fall of Earth’s temperature tracks rather closely with the amount of CO2 in the atmosphere. Theoretically.
We can also see evidence of a cycle of high temperatures and then low temperatures. The cycle hits a ‘high’ about every 100,000 years. The warming cycle we’re currently in began about 20,000 years ago, at roughly the same time that CO2 levels began rising again.
Some of the ‘temperature highs’ in the distant past were higher than where we’re at in 2022. Approximately 123,000 years ago, the global temperature was almost 3º higher than the average used in this scale. As we can see, the current global temperature is lower than the ‘peaks’ that happened about every 100,000 years. According to the historic cycle, we should be heading for another peak, maybe 1.8º higher than “average”. We’re not there yet. Or so the science tells us.
We understand that all of these numbers, from thousands of years ago, are purely theoretical… based on the same kind of computerized climate models that are predicting a dire future for the planet… a dire future, unless…
Unless what? Unless we all switch to solar panels and wind turbines and massive storage batteries, and make everything run on electricity? Or some other solution?
My friend’s email, mentioned at the beginning of this article, included a comment about journalists trying to discuss the scientific evidence of impending disaster, when the journalists are typically not scientists. And of course, the scientists are not journalists. So maybe we have a breakdown in communication, when a journalist writes, on a popular website:
The Western U.S. is in the midst of its worst megadrought in 1,200 years, and the climate crisis has made the drought 42 percent more extreme than it would have been otherwise…
In my limited experience writing occasionally about scientific evidence and such, a scientist often approaches a subject as complicated and complex as global climate with a measure of humility. But some scientists make statements as if the evidence consists of proven facts that no one ought to question. (Especially, no one who is merely a journalist.)
The journalist’s statement mentioned above, about the “megadrought” and the “42 percent more extreme”, was inspired by a scientific paper titled, “Rapid intensification of the emerging southwestern North American megadrought in 2020–2021” written by scientists A. Park Williams, Benjamin I. Cook and Jason E. Smerdon.
The paper appeared in Nature Climate Change earlier this month.
All three of these scientists are connected with the Lamont-Doherty Earth Observatory in New York, which has received $15.1 million in grants from the Gordon and Betty Moore Foundation over the past nine years, for scientific work related to climate. We might assume that Mr. and Ms. Moore have been pleased with the published papers coming from the Observatory.
The March 2022 paper includes the following graph, showing the flows in the Colorado River between 1905 and 2021. We can see what appears to be a slight ‘downward trend’ over those 115 years, supposedly indicating the slow descent into “megadrought”.
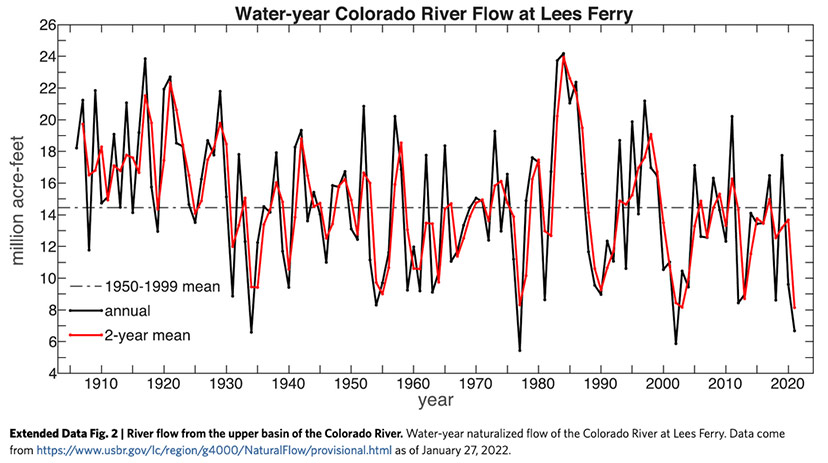
But if you look at the period between 2000 and 2021 — the red line, the 2-year mean — and you compare it to the period between 1953 and 1967… well, not too much difference that I can see. The River has had its ups and downs, with the biggest ‘up’ coming in the mid-1980s.
I don’t know how many similar graphs — of the Colorado River flows — I’ve come across over the past ten years, but the vast majority of the graphs seem to start with 1905.
Why 1905? Why not… 1890, for example?
Perhaps… because including the data from a massive (mega?) drought during the 1890s would totally ruin the appearance of a ‘downward trend’.
This quote is from “History of Colorado River Law, Development and Use” by Greg Hobbs Jr.:
Contrary to the now popular notion that the compact commissioners had only really good water years [data] to work with and, so, hugely over allocated the available supply, they were well aware of the extended drought of the 1890s that lasted through 1902.
And from Wikipedia:
The 1890s drought, between 1890 and 1896, was the first to be widely and adequately recorded by rain gauges, with much of the American West having been settled. Railroads promised land to people willing to settle it, and the period between 1877 and 1890 was wetter than usual, leading to unrealistic expectations of land productivity. The amount of land required to support a family in more arid regions was already larger than the amount that could realistically be irrigated by a family, but this fact was made more obvious by the drought, leading to emigration from recently settled lands…
The early 1900s were unusually wet years, giving just the right impression of a ‘declining Colorado River’, for those who are impressionable.
If I were a scientist, counting on millions of dollars in grant funding for my Earth Observatory, I might be inclined to pick the starting date on my graph carefully.