
The Western U.S. is in the midst of its worst megadrought in 1,200 years, and the climate crisis has made the drought 42 percent more extreme than it would have been otherwise…
— from an article about Lake Powell, posted by the World Economic Forum, March 22, 2022.
As I write this editorial, I can hear the washing machine running quietly in the laundry room. It’s a new front-loading washer that uses about 20 gallons of warm water per load. We can compare that to older top-loading machines that used about 50 gallons of water per load. Since my family does an average of one load per day, we have been ‘saving’ about 900 gallons of treated drinking water per month.
Not that this makes a dent in the problems they’re having at Lake Powell. In fact, it makes almost no difference at all, because the 20 gallons of water per load drains back into the San Juan River following treatment at our Vista Waste Water Treatment Plant. Same goes for showers, dish washing, and nearly all other household water uses. Even the water we drink ultimately goes back into the system.
Which is to say, my family’s impact on the Western U.S. water situation is utterly insignificant, at least until we start watering our garden again.
Agriculture — now that’s a different situation altogether.
Back in 2007 — when the editor of the Pagosa Daily Post (me) knew almost nothing about the Colorado water industry — our community’s future looked ominous in terms of pending water shortages. Or so we were told. Two local water districts, Pagosa Area Water and Sanitation District (PAWSD) and San Juan Water Conservancy District (SJWCD) had just published a report indicating that the community would be experiencing water shortages by the year 2015.
The 16-page ‘feasibility study’ — written by water engineer Steve Harris — predicted a community drinking water demand of 5,081 acre-feet by the year 2020.
In fact, PAWSD water demand in 2020 was about 1,250 acre-feet, less than the water demand in 2001. I guess a lot of people have purchased new washing machines?
Mr. Harris’ fear-mongering 2007 report did very little to disturb the sleeping patterns of the average citizen, but it frightened the PAWSD Board of Directors and the SJWCD Board of Directors enough to spend $10 million (which they borrowed without voter approval) to purchase a ranch in the Dry Gulch Valley, with plans to build a 35,000-acre-foot reservoir.
Fear-mongering can be a problem for the average citizen, but it can be an important tool for people with an agenda.
And because water is absolutely necessary to life, a predicted shortage or drought can easily stir up anxiety.
On Friday, in Part Two of this editorial series, I mentioned the National Oceanic and Atmospheric Administration and their willingness to conflate a “warmer climate” with a “drier climate”.
Warmer = Drier
This might make sense… although scientists have, in my humble opinion, only a comparatively vague understanding of global weather and climate. ‘Climate’ is an incredibly vast and complex system. Weather can be predicted with some confidence a few weeks in advance, but the amount of precipitation that a region will receive over a year’s period… or a ten-year period? Our scientists don’t do much better than The Farmers Almanac.
Being a curious person, I visited the National Integrated Drought Information System (NIDIS) website, to try and learn more about how ‘climate change’ might be related to ‘drought’.
The site has a good deal of interesting and scientifically-inclined information. For example, it can generate maps showing areas of abnormal drought and abnormal wetness for any area of the U.S., for any month between 1895 and 2022.
Here is the NIDIS map for the month of October, 1911. The areas in the darkest blue were experiencing “Exceptionally Wet” conditions. The areas shown in the darkest red were experiencing “Exceptional Drought”.
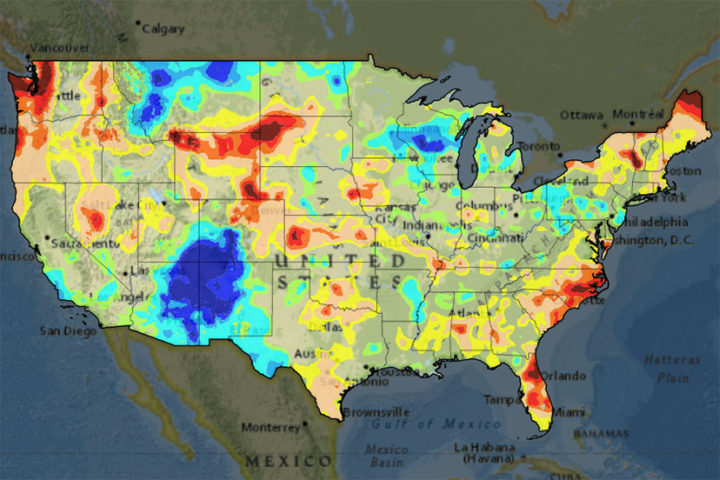
I picked this particular month and year because a little town in rural southern Colorado — Pagosa Springs — experienced a horrific flood in October 1911. All of its bridges were destroyed, and several homes and buildings built along the San Juan River were washed away or damaged.
The NIDIS map correlates pretty closely with this historic event, because as we see, Pagosa Springs and the southwest corner of Colorado is shown in the darkest blue: “Exceptionally Wet”.
Below are a couple more maps generated by NIDIS.
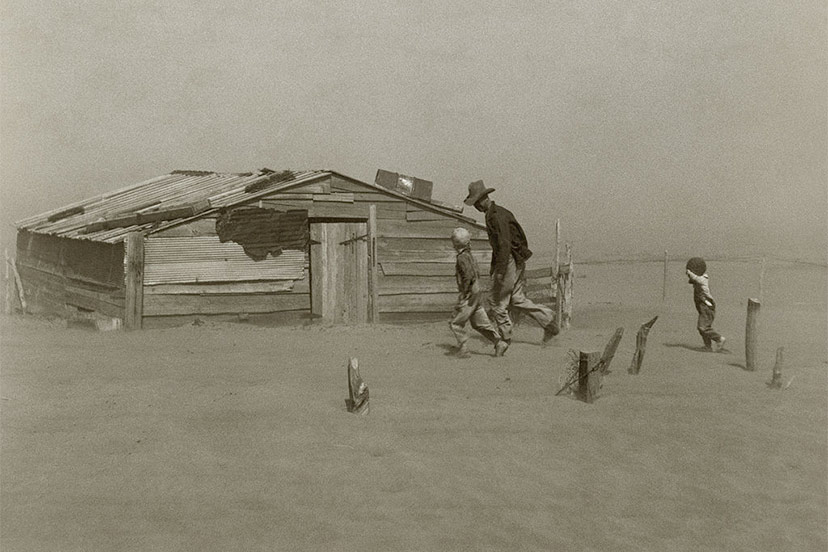
Between 1934 and 1941, the central part of the U.S. experienced a series of catastrophic climatic events collectively labeled by historians as “The Dust Bowl”, a period of severe dust storms that greatly damaged the ecology and agriculture of the American and Canadian prairies during the 1930s. Severe drought and a failure to apply dryland farming methods to prevent wind erosion combined to create a human and ecological calamity. The drought came in three waves: 1934, 1936, and 1939–1940, but some regions of the High Plains experienced drought conditions for as many as eight years.
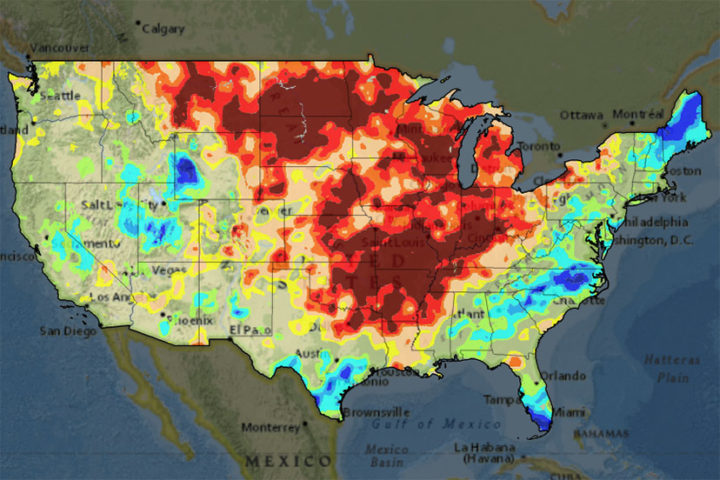
Here’s the NIDIS map from July 1936. We can see the extensive “Exceptional Drought” underway that summer across the High Plains.
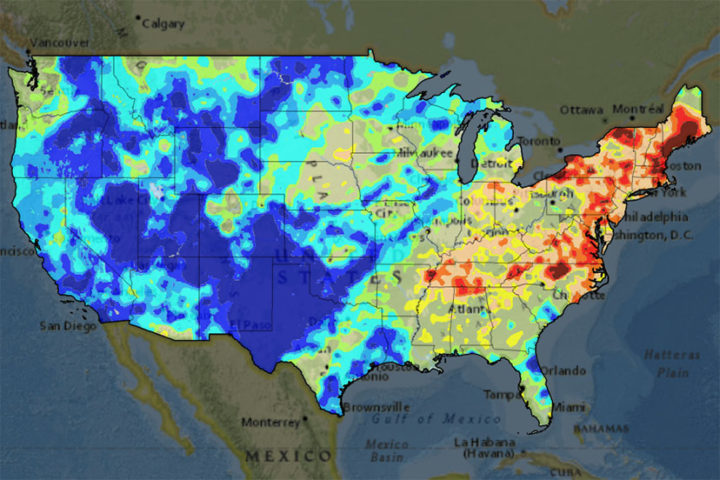
Here’s another map, showing the month of December, 1941. By late 1941, the terrible “Dust Bowl” ecological disaster — exceptional drought made catastrophic by unsound agricultural practices — was already headed for the history books. I have no idea why, in December 1941, about 68% of the nation was experiencing abnormally wet weather. I suspect our climate scientists also have no clear idea why.
Who can explain the fickle ways of Mother Nature?
But maybe her ways aren’t as fickle as I thought, when we take a longer view. Here’s another image from the same NIDIS website:
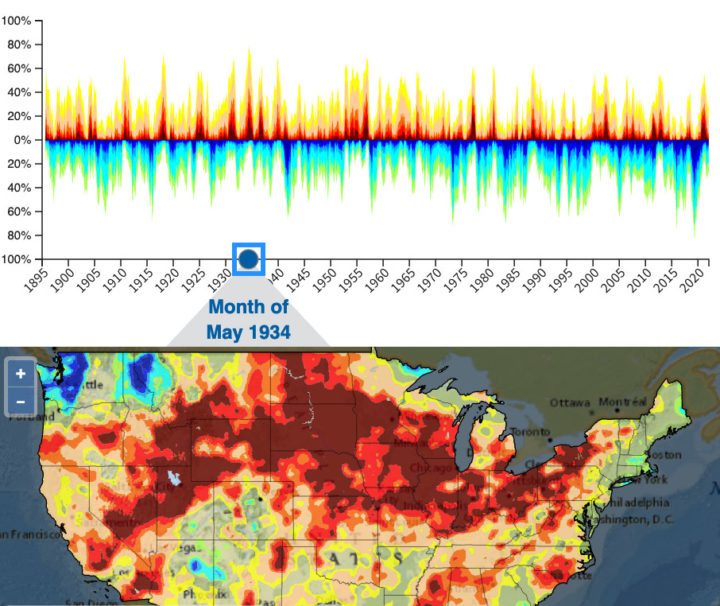
In the graph at the top, NIDIS scientists have summarized — along a time line — the periods of abnormal drought and abnormal precipitation for the Lower 48 states, between 1895 and 2022.
If we look closely, for example, at the drought maps related to the “Dust Bowl” period between 1934 and 1940, we see relatively little dark blue (Exceptionally Wet) and a relatively hefty dose of red and dark red (Extreme and Exceptional Drought)… followed, in 1941, by a dramatic spike of dark blue, and very little red…
…and very little red for the next decade.
Plus, there’s something pretty interesting going on, I think, when you consider the entire graph…