
The average number of new cases increased more than 40 percent over a two-week period in New Mexico, Colorado, Illinois and Minnesota. Vaccination rates in those states are a bit above the national average, and the outlook is not yet nearly as dire as what Southern states saw this summer.
Conditions continue to improve in the South. Florida and Louisiana, which had two of the worst summer surges, are reporting new cases at some of the lowest rates in the country.
There are fewer than half as many coronavirus patients in American hospitals as there were in early September.
— from The New York Times, November 15, 2021.
The pictures are somewhat mysterious, if you believe that the public health industry’s approach to COVID should result in clear and rational data.
Here’s a ‘vaccination rate’ map from The New York Times, November 15, 2021.
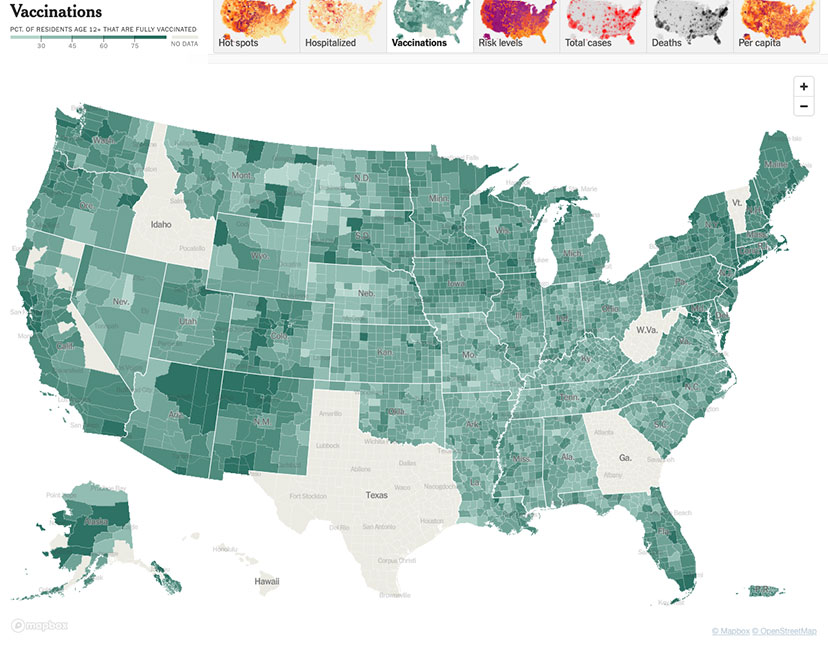
We will note just a few things. The overall vaccination rate in Alabama, Mississippi and Louisiana and Missouri is below 50%, and largely below 40%.
The vaccination rate in most of Northern New Mexico is above 60%, and in some places above 70%.
Here are the hot spots — current ‘number of daily cases’ — per The New York Times.
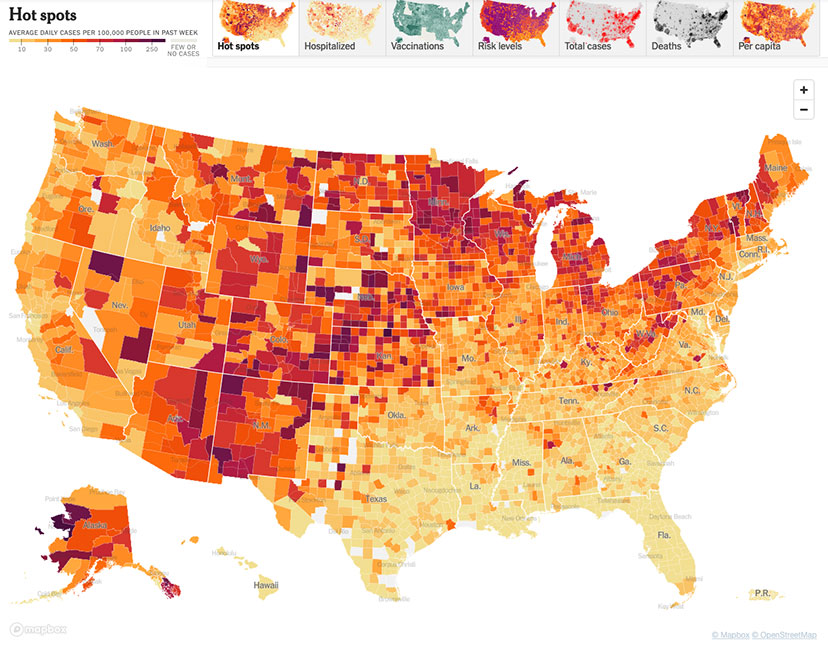
To look at these two maps, you might not immediately draw a correlation between ‘vaccinations’ and ‘number of daily cases.’ The current situation in Alabama, Mississippi and Louisiana looks pretty good, at the moment.
Northern New Mexico, not so good.
But even the ‘number of daily cases’ — in November 2021 — is not necessarily directly related to the stress on local hospitals. ‘Hospitalizations’ would have to be the most concerning data, for those of us trying to understand a global pandemic. A large number of ‘daily cases’ that don’t result in ‘hospitalizations’? Perhaps people are recovering on their own?
But from what I have been told, there is a strong correlation between hospitalization and death.
The New York Times shows Archuleta County as part of the ‘Durango’ hospital service area. In the ‘hot spots’ map above, Archuleta and La Plata Counties are shown in a relatively darker shade of red… as is San Juan County, as well, in the top left corner of New Mexico.
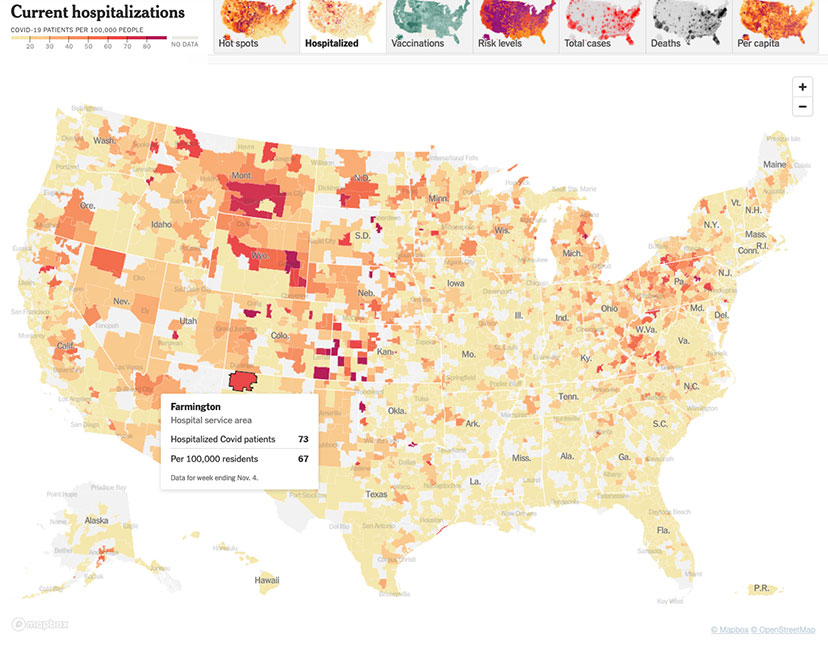
San Juan County is served by the ‘Farmington’ hospital service area.
The hospitalization rates do not directly correspond to the ‘vaccination rates’ (top map)… nor to the ‘hot spots’ map…
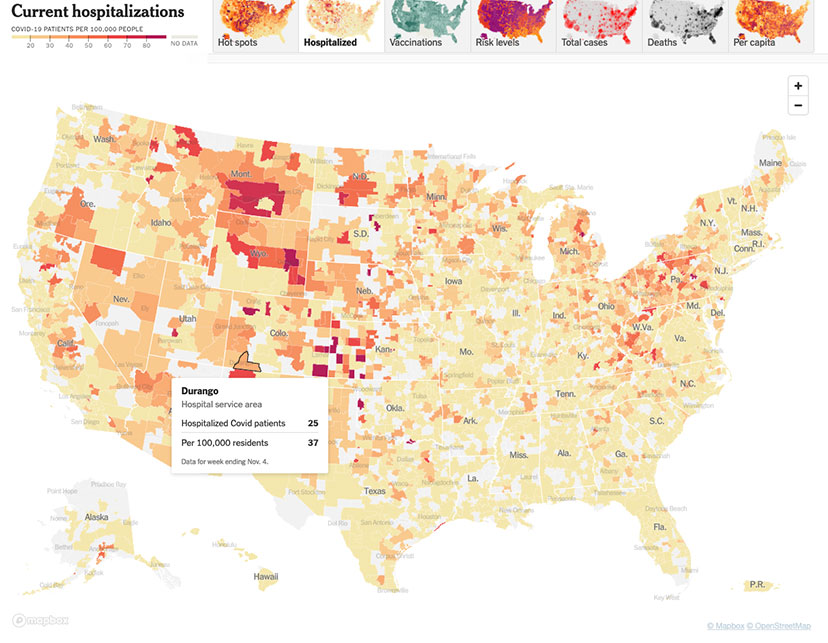
Hospitalization rate in Durango: 37 cases per 100,000 population.
Hospitalization rate in Farmington: 67 cases per 100,000 population.
Hospitalization rate in Alabama, Mississippi and Louisiana: below 20 cases per 100,000 population, for the most part.
Why would the hospitalization rate in one of the most successfully-vaccinated places in the U.S — northwestern New Mexico — be three-and-a-half times the hospitalization rate in the country’s southern states, where the vaccination program has been much less successful?
I ask the question, but don’t expect an answer.