
I woke up this morning and shuffled into the bathroom to take a shower. I adjusted the shower curtain along the edge of the bathtub, to make sure no water got on the floor, and then ran the water for a minute or so to allow the hot water to arrive from the water heater in the basement. I stepped in and began washing, and soapy water disappeared down the bathtub drain.
As I understand it, the clean water I used this morning had recently traveled through a 15-mile pipeline from the headwaters of the San Juan River — from the West Fork of the San Juan, to be more precise — and had been treated at a treatment plant on Snowball Road, and then pumped up to the big green water tank at the top of Reservoir Hill, about half a mile south of my house.
How the water made itself into the West Fork in the first place is a bit more complicated.
And what happened to the water after it went down my bathtub drain is even more complicated. Theoretically, it could have made its way into Lake Powell — the massive artificial reservoir that straddles the border between Utah and Arizona — and then into Lake Mead, 300 miles to the west, and finally into someone’s shower in Las Vegas, Nevada.
But somehow, some of the water will eventually get back to the West Fork again, as rainfall or snow. Or at least, that’s what has been happening for the past 10,000 years.
I ran across a series of slides this morning, posted to the Web by a biologist named Jeff Lukas. Mr. Lukas works with CIRES, the Cooperative Institute for Research in Environmental Sciences, and he had posted a slide that looked like this:

I’d run across a similar graph in my past research into Colorado water issues. Mr. Lukas’ graph is based on the study of tree rings as they relate to the local climate where the tree had grown. In the above graph, we are looking at the long-term stream flows of the Colorado River, as measured at Lee’s Ferry, just upstream from the majestic Grand Canyon, based on that tree-ring data.
Lee’s Ferry marks a political dividing line between the Upper Colorado River water users and the Lower Colorado River water users. When the Colorado River Compact was signed in 1922, the allocation of water between the Upper and Lower Basins was to be calculated based on the flow of water past Lee’s Ferry.
I believe Mr. Lukas got his data from a University of Arizona study contracted by the California Department of Water Resources in 2006, and performed by David M. Meko at the Laboratory of Tree-Ring Research. Scientists have noted a clear correlation between the composition of tree rings, in certain species of trees, with the observed local climate, and have taken to using tree-ring data to construct charts of regional climate patterns going back hundreds of years to an era where no human records exist.
In the Colorado River graph, shown again below, we are looking at the theoretical flow of the Colorado River at Lee’s Ferry, between the year 762 and the year 2005. The straight line running down the center indicates 15 million acre-feet per year, and the wavy line shows the 20-year running average.
Mr. Lukas has colored, in light blue, the period between 1906 and 2005, during which water experts were actually measuring the Colorado River flow in acre-feet per year. The tree-ring data tracks fairly close to the actual observed flows, I understand, though the correlation is not absolutely perfect.
We also see that Mr. Lukas has colored, in pale yellow, the period between about 1125 and 1175 — a rough period for trees, animals and people in the American Southwest, due to a 50-year drought. As we see, the theoretical flows in the Colorado River dropped from the more typical 15 million acre-feet per year to around 13 million acre-feet.
Mr. Lukas also provided the following chart:

Here we see the flows in the Colorado River, averaged over 100-year periods. As we can see, most of the past centuries saw lower flows in the Colorado, when averaged of a long period. Only the 100-year period between 1300 and 1400 saw more water running past Lee’s Ferry than we’ve seen over the most recent period.
We’ve actually had it pretty good. Considering.
Except that we’ve massively changed the way water flows in the Colorado River. The Upper Basin states have built at least 20 major dams and reservoirs on the tributaries of the mighty Colorado, and more are planned. According to Wikipedia, these Upper Basin dams can hold back a total of about 10 million acre feet, if they are all full. Most of them are not full, in 2018.
The Lower Basin also maintains a number of major reservoirs on the Colorado River tributaries — about 11 of them, with a total reservoir capacity of about 9 million acre feet.

We have 14 major dams along the main stem of the Colorado, including Lake Powell (contained by Glen Canyon Dam) and Lake Mead (contained by Hoover Dam.) Those 14 dams hold back a maximum of about 58 million acre feet of water, when we have enough water to fill them all.
Right now, in 2018, some of them are only half full. Like, for example, Lake Mead.
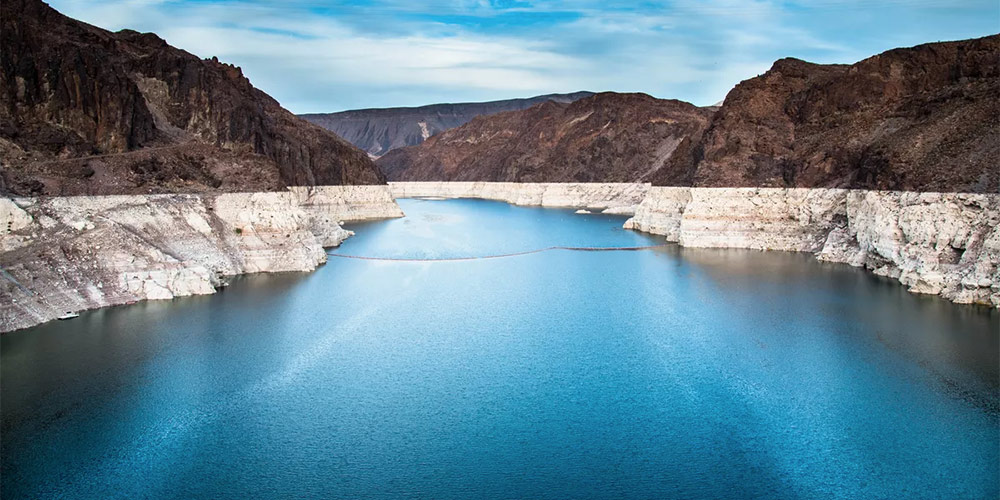
The lake has not reached full capacity since 1983, due to a combination of drought and increased water demand. As of August 2017, Lake Mead was at approximately 40% of full capacity, with 10 million acre feet of held water. It has been smaller than Lake Powell (the second largest US reservoir, when both are full) since 2013.
Before the filling of Lake Powell, the Colorado River flowed largely unregulated into Lake Mead. During the filling of Lake Powell from 1963 to 1965, Mead’s water level fell from 1,205 to 1,090 feet, but multiple ‘wet years’ from the 1970s to the 1990s filled both lakes to capacity, with Mead reaching a record high of 1,225 feet in the summer of 1983.
During those decades, prior to 2000, Glen Canyon Dam frequently released more than its required 8 million acre feet to Lake Mead each year. This allowed Lake Mead to maintain a high water level despite releasing significantly more water than it is contracted for. But since 2000, the Colorado River has experienced persistent drought, with average or above-average conditions occurring in only five years (2005, 2008–2009, 2011 and 2014) in the first 16 years of the 21st century.
In order to ensure that the city of Las Vegas would continue to be able to draw its drinking water from Lake Mead, nearly $1.5 billion was spent on building a new water intake tunnel in the middle of the lake at the elevation of 860 feet. The 3-mile tunnel took seven years to build and was put into operation in late 2015…