
At a recent Town Council meeting, Town Manager Andrea Phillips summarized some results from the 2018 Community Parks & Recreation Survey conducted this past spring. 518 people responded to that survey, with about 84 percent (about 435 people) claiming to be Archuleta County residents, which indicates responses from about 3 percent of the county population.
As I mentioned yesterday in Part One, the Pagosa Pickleball Club made a special effort to get their supporters to responded to the survey, as did the the Geothermal Greenhouse Partnership. I don’t know whether those efforts biased the survey results, nor do I know if any other recreational groups promoted the survey to their members.
The responses were summarized in graphs, like this:
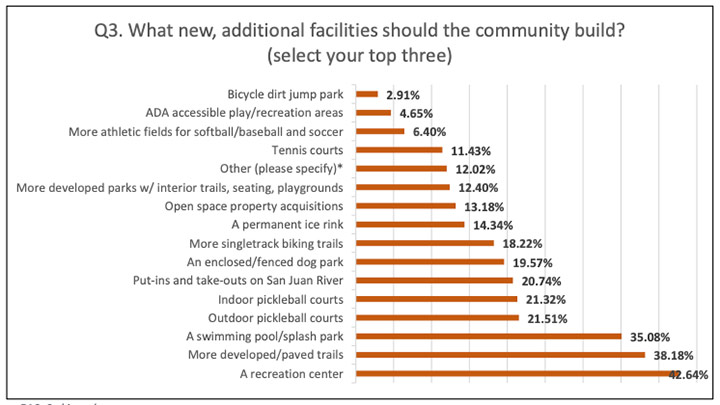
One of the questions asked which park amenities we use most, and the community picked the San Juan River Walk, Reservoir Hill, and Yamaguchi Park — the three largest amenities in downtown — as the winners. Runner-ups were the PLPOA recreational amenities (Rec Center, trails, lakes) and the Ross Aragon Community Center.
You can review all of the survey results here in this PDF.
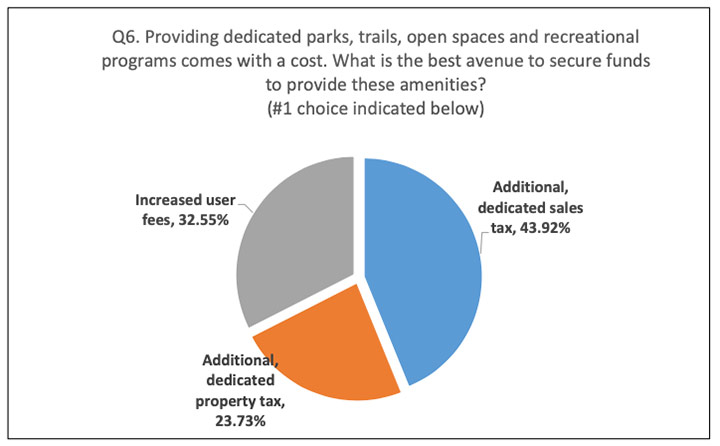
When asked how we would prefer to fund an ever-growing parks and recreation budget, the most popular response was, “Additional, dedicated sales tax.”
When we very briefly discussed this taxpayer-funded survey, yesterday, I mentioned one little problem. The Town poll repeatedly assumed that the community wants more recreation amenities than we have already.
But the survey never asked us if that’s really what we want.
Maybe we don’t actually want new, additional facilities? Who knows? I have an opinion, of course… but opinions are a dime a dozen.
Or even… absolutely free?
Most of the respondents to the Parks & Rec poll participated in the online version of the survey, hosted at SurveyMonkey.com. It’s become pretty simple and affordable to conduct public opinion surveys, thanks to websites like Survey Monkey. Nowadays, even a low-budget operation like the Daily Post can easily conduct a public opinion survey. In fact, as an exercise, I designed and posted a new three-question Daily Post survey at Survey Monkey this morning (July 17).
Not a serious poll. I spent all of 15 minutes designing it, start to finish.
Survey Monkey has a free plan (which I used to create my survey) and the Survey Monkey system rated my survey design as “Perfect.” (Not sure what that means, but it can’t be a bad thing.)
If any of our readers would like to create their own public opinion survey, I can recommend it as a fun and educational project. And thanks to social media and the Internet, it’s not too hard to publicize a survey to community members. Plus, you don’t need to know much about survey design in order to complete the process.
But “low cost, easy to distribute, and can be created by a sixth grader” does not necessarily correlate with “useful, factual information.” If we want to create a useful public opinion survey, we will want to do some research into survey design. Some folks think it’s not rocket science to design a meaningful survey, but in fact… it’s really rocket science.
Just ask the folks at the Pew Research Center.
The Pew Research Center is a non-partisan ‘fact tank’ that has made it their mission in life to “generate a foundation of facts that enriches the public dialogue and supports sound decision-making.” Part of this mission to inform the public about the issues, attitudes, and trends shaping the US and the world, and to that end, the Center engages in public opinion polling, demographic research, media content analysis, and other empirical social science research.
In 2017, the experts at Pew Research published a lengthy essay (34 pages long) that briefly summarizes the difficulties encountered when attempting to get accurate facts about public opinions. For example, we have the problem of “question order.”
From that essay:
Once the survey questions are developed, particular attention should be paid to how they are ordered in the questionnaire. The placement of a question can have a greater impact on the result than the particular choice of words used in the question.
The folks at Pew discovered, for example, that when they asked Americans if they favored legal agreements that would allow gay couples to obtain the same rights as heterosexual married couples — that is, ‘legal agreements’ as opposed to legalized gay marriage — it mattered a great deal the order in which the questions were asked.
Americans polled were significantly more likely to favor allowing gays and lesbians to enter into legal agreements when this question was asked after another question about whether they favored or opposed allowing gays and lesbians to be legally married.
45% of Americans approved of ‘legal agreements’ when asked after a question about gay marriage.
Only 37% favored ‘legal agreements’ when that was the first question asked.
Survey design runs into many other issues, if you are attempting to get accurate public opinion information. For one thing, opinions follow trends and tend to change over time. For another, different types of questions — multiple choice, open-ended, closed-ended — elicit different statistical results about the very same issue.
And the way a question is worded sometimes makes a huge difference. When Americans were asked by Pew Research whether they would “favor or oppose taking military action in Iraq to end Saddam Hussein’s rule,” 68% said they favored military action; only 25% said they opposed military action.
However, when asked whether they would “favor or oppose taking military action in Iraq to end Saddam Hussein’s rule even if it meant that US forces might suffer thousands of casualties,” the responses were dramatically different. Only 43% favored military action, while 48% said they opposed it. The introduction of “US casualties” altered the context of the question and influenced whether people favored or opposed military action in Iraq.
Some public opinion surveys are not actually attempting to obtain useful facts, however. Some surveys are cleverly designed to sell an agenda, by asking seemingly innocent questions that lead the survey participant towards a preconceived conclusion.
With that thought in mind, let’s get back to the recent Public Opinion Survey conducted by the Archuleta School District (ASD) in collaboration with the investment bankers at George K. Baum.
Last week, I had a chance to sit down with a big stack of survey documents at the ASD administration building. Unlike the Town’s Parks & Recreation Survey which had zero controls over who filled out the survey (nor how many times the same person filled out the survey) the ASD survey was mailed out only to registered voters within the District — about 5,300 of them.
When I quickly sorted through the provided documents, I counted 697 surveys. A 13 percent response rate, in other words.
The District had already provided me with a summary of the survey results, and I just wanted to double check their math. (The District being, after all, the primary source of math instruction for the children of the community…)
Our numbers matched reasonably well.

Bill Hudson began sharing his opinions in the Pagosa Daily Post in 2004 and can’t seem to break the habit. He claims that, in Pagosa Springs, opinions are like pickup trucks: everybody has one.